
Back to article: The role of invariant surface glycoprotein 75 in xenobiotic acquisition by African trypanosomes
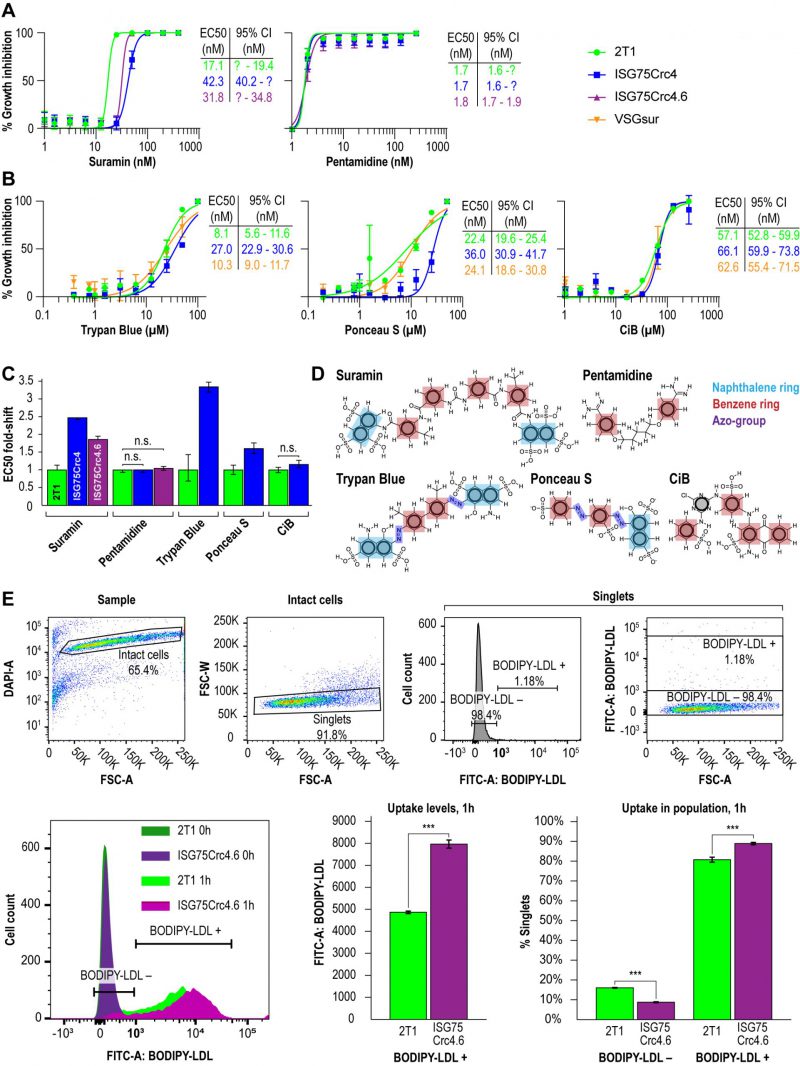
FIGURE 3: Impact of ISG75 on drug sensitivity. (A) EC50 curves showing shift in resistance to suramin and pentamidine in ISG75Crc4 and ISG75Crc4.6 cell-lines. (B) EC50 curves showing shift in resistance to trypan blue, ponceau S and cibacron blue in ISG75Crc4 compared to VSGsur. (C) Dynamite-plot showing respective shifts in EC50. Error bars, 95% confidence interval (CI). Asymmetric confidence intervals (95% CI) were calculated where possible in GraphPad PRISM and statistical significance of each EC50 shift assessed by confidence interval overlap – overlapping CI indicated absence of statistically significant shift. (D) Structures of drugs studied. Highlighted in light blue are naphthol moieties in suramin, trypan blue and ponceau S in red are single aromatic benzene rings and in dark blue are azo-groups. (E) Flow cytometry gating strategy (top) and representative flow cytometry histogram with bar-plots (bottom) showing LDL uptake upon knockout of ISG75 in ISG75Crc4.6. Bar plot error bars, standard errors from biological replicas, *** indicates p-value < 0.01.