
Back to article: The role of invariant surface glycoprotein 75 in xenobiotic acquisition by African trypanosomes
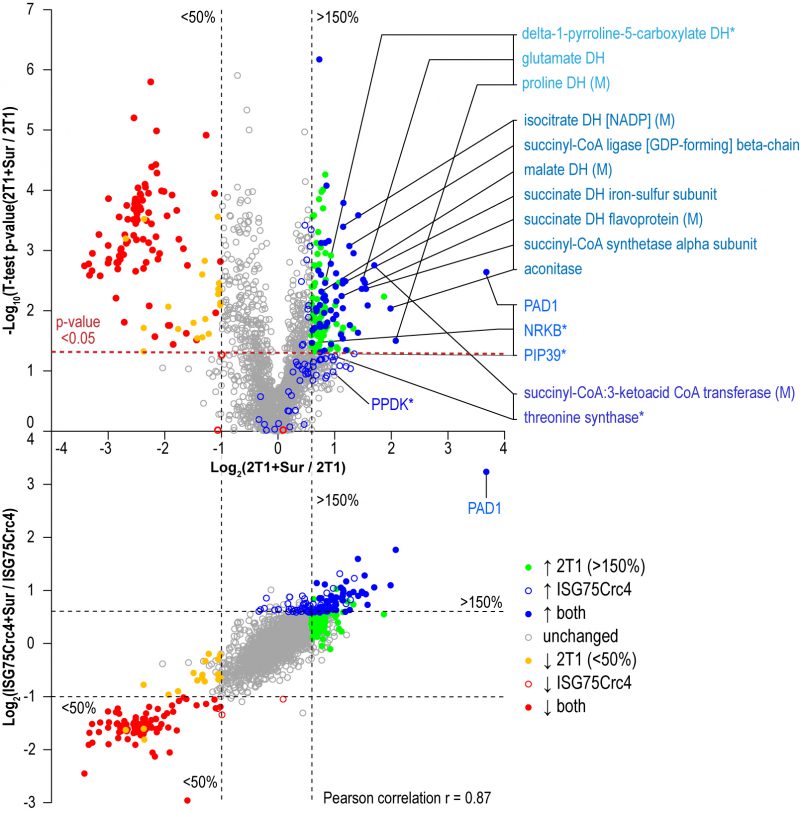
FIGURE 4: Changes in protein expression levels in suramin-treated cells. Volcano plot of protein level changes in parental cells with and without suramin (top). Coloured respectively are proteins significantly up- or down-regulated (p-value < 0.05) only in parental, only in ISG75Crc4 and in both as indicated after exposure to suramin. Additionally highlighted in coloured groups (top to bottom, lighter to darker blue shades) are proteins involved in proline catabolism, mitochondrial activation and Krebs' cycle, early BSF/PCF differentiation markers, and proteins involved in threonine metabolism as indicated. Single asterisk (*) marks PIP39 and PPDK that display similar upregulation as shown previously, but did not reach statistical significance (p-values of 0.052 and 0.103 respectively); and NRKB and threonine synthase that displayed similar trends in parental and ISG75Crc4, but have low significance levels in one or both samples (NRKB, 1.5-fold increase in both parental and ISG75Crc4 with p-values of 0.034 and 0.093 respectively; TS, 1.9-fold increase with p-value 0.059 in parental and 1.7-fold increase with p-value 0.094 in ISG75Crc4). Correlation plot of proteins increased or decreased in parental and ISG75Crc4 cell-lines (bottom). Coloured dots are significantly altered proteins. Overall Pearson correlation coefficient r = 0.87.