
Back to article: The role of invariant surface glycoprotein 75 in xenobiotic acquisition by African trypanosomes
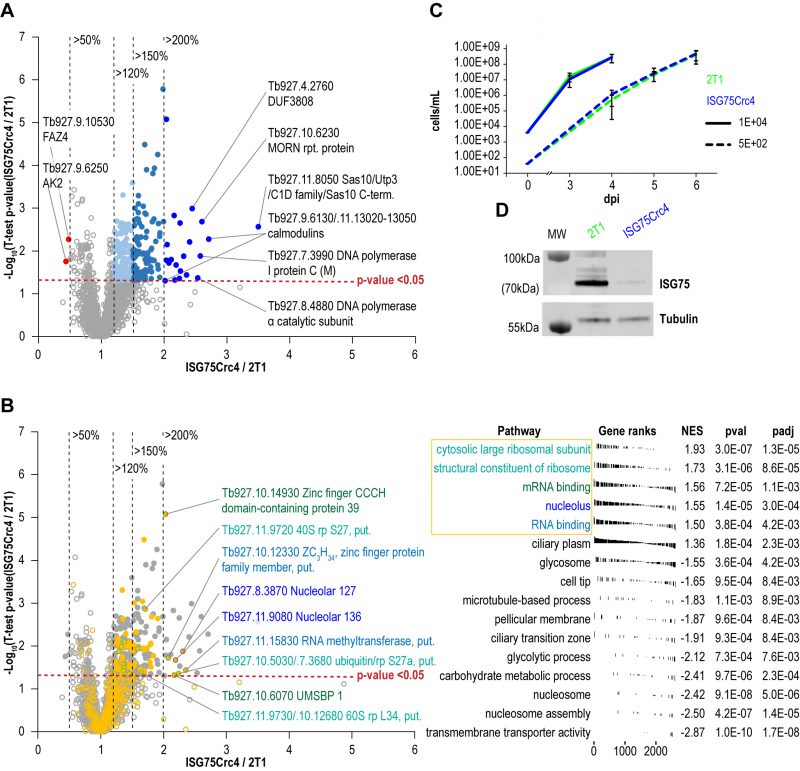
FIGURE 5: Changes in protein expression levels in ISG75 knockout cells. (A) Volcano plot showing distribution of protein level changes in in ISG75Crc4 cells. Proteins and protein groups increased 1.2-fold, 1.5-fold to 2-fold and 2-fold or more with p-values < 0.05 are shown respectively in light blue, turquoise and dark blue filled circles, protein groups decreased 2-fold or more – in red, non-significantly shifting protein groups – in grey unfilled circles. (B) FGSEA output showing most enriched GO-terms among all proteins in A. Top five groups are shown in orange. Unfilled circles all proteins, filled circles proteins with increased expression (Table 1 and 2). Labelled circles with coloured outlines are proteins with most increased expression in these groups. (C) Parasitaemia levels in Balb/C mice blood on days three and four post infection with 104 ISG75Crc4 cells and days four to six post infection with 102 cells, top and bottom respectively. Error bars, standard error. (D) Western Blot analysis of lysates of 2T1 and ISG75Crc4 cells extracted on day four terminal bleeds of mice infected with 104 cells shows persistent depletion of ISG75 in trypanosomal cell when in host environment – similar to that observed in vitro.