
Back to article: Exploring carbon source related localization and phosphorylation in the Snf1/Mig1 network using population and single cell-based approaches
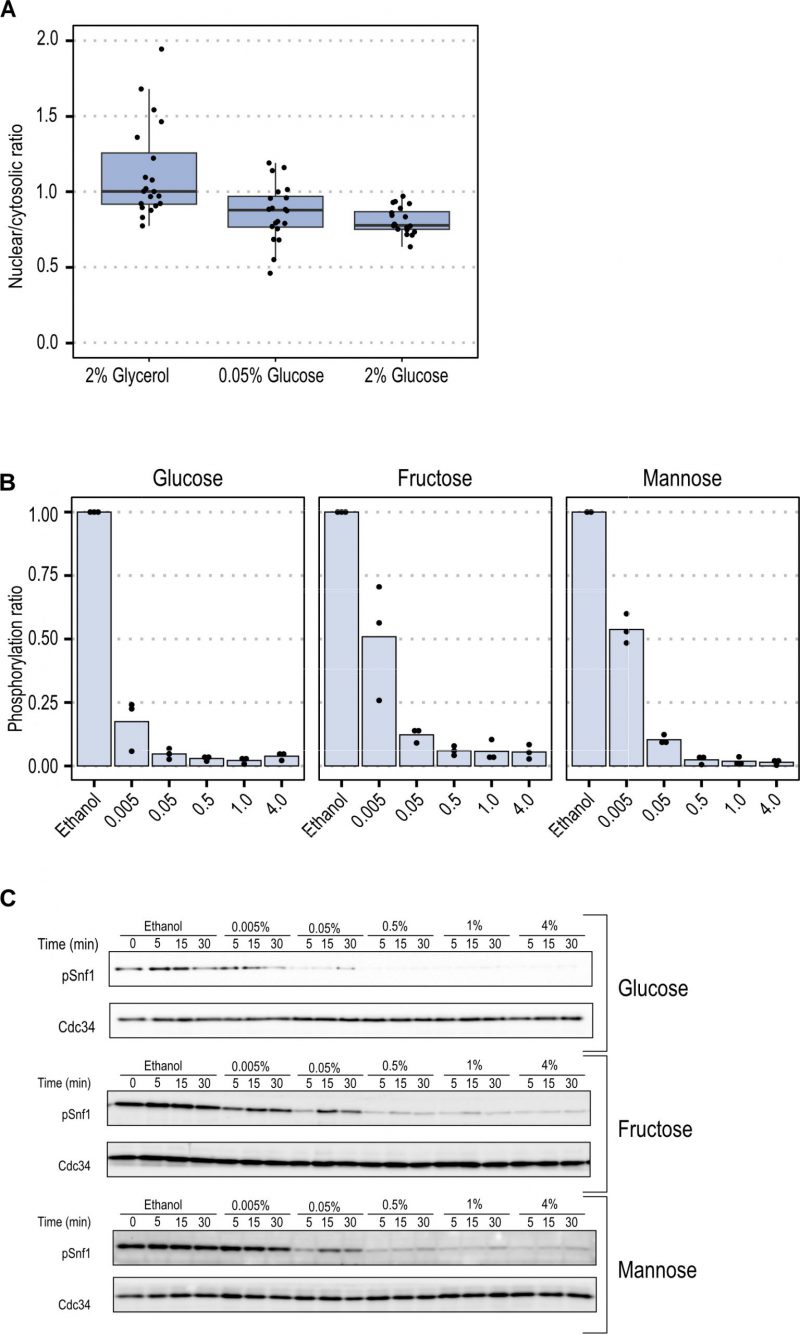
FIGURE 2: Snf1 localization and Snf1 phosphorylation. (A) The nuclear-cytosolic ratio of Snf1-GFP was calculated by dividing the mean of the fluorescence of Snf1-GFP in the nucleus with the mean of the fluorescence in the cytosol. Horizontal lines indicate the mean, the boxplot has as lower and upper hinge respectively the 25thand 75th percentile and the whiskers denote the 95% confidence interval. Dots denote individual cells. (B) Mean of relative Snf1 phosphorylation by western blot quantification 5 minutes after upshift from ethanol to glucose, fructose or mannose, dots represent biological replicates.(C) Exemplary images of the western blot showing phosphorylated Snf1.