Research Articles:
Microbial Cell, Vol. 11, No. 1, pp. 198 - 206; doi: 10.15698/mic2024.06.825
Expansion of metabolically labelled endocytic organelles and cytoskeletal cell structures in Giardia lamblia using optimised U- ExM protocols

1 Institute of Cell Biology, University of Bern, Bern, Switzerland.
2 Graduate School for Cellular and Biomedical Sciences, University of Bern, Bern, Switzerland.
3 Multidisciplinary Center for Infectious Diseases, University of Bern, Bern, Switzerland.
4 Institute of Infectious Diseases, University of Bern, Bern, Switzerland.
a Equal contribution as a first author.
Keywords: Giardia lamblia, expansion microscopy, subcellular compartment, metabolic labelling, endocytosis, cytoskeleton, endoplasmic reticulum.
Received originally: 16/10/2023 Received in revised form: 08/04/2024
Accepted: 17/04/2024
Published: 21/06/2024
Correspondence:
Carmen Faso, Institute of Cell Biology, University of Bern, Bern, Switzerland; carmen.faso@unibe.ch
Torsten Ochsenreiter, Institute of Cell Biology, University of Bern, Bern, Switzerland; torsten.ochsenreiter@unibe.ch
Conflict of interest statement: All authors declare that they have no conflicts of interest.
Please cite this article as: Clirim Jetishi, Erina A Balmer, Bianca M Berger, Carmen Faso, Torsten Ochsenreiter (2024). Expansion of metabolically labelled endocytic organelles and cytoskeletal cell structures in Giardia lamblia using optimised U- ExM protocols. Microbial Cell 11: 198-206. doi: 10.15698/mic2024.06.825
Abstract
Understanding cellular ultrastructure is tightly bound to microscopic resolution and the ability to identify individual components at that resolution. Expansion microscopy has revolutionised this topic. Here we present and compare two protocols of ultrastructure expansion microscopy that allow for 4.5-fold mostly isotropic expansion and the use of antibodies, metabolic labelling, and DNA stains to demarcate individual regions such as the endoplasmic reticulum, the nuclei, the peripheral endocytic compartments as well as the ventral disc and the cytoskeleton in Giardia lamblia. We present an optimised, shortened, and modular protocol that can be swiftly adjusted to the investigators needs in this important protozoan model organism.
INTRODUCTION
Expansion microscopy (ExM) was first described by Ed Boyden’s team in 2015 and is a powerful technique to overcome the diffraction limit of light microscopy 1. The high resolution of ExM is achieved by physically enlarging the specimen, which is embedded into a swellable polymer that can be isotropically expanded. Unlike other super-resolution methods, which heavily rely on advanced optical instrumentation, ExM is mainly operated with conventional microscopes. While the first ExM protocol was a pre-expansion labelling protocol, meaning that the labelling of the specimen occurred before expansion, more recently researchers developed post-expansion labelling techniques, where labelling is introduced after expansion 2, 3. The ultrastructure expansion microscopy (U-ExM) protocol was presented by Gambarotto et al. 4 in 2018 as an optimization of the magnified analysis of the proteome (MAP) protocol as a post-expansion labelling protocol 4, where improvements on the structural integrity and preservation of ultrastructural details were achieved compared to standard ExM protocols. Importantly, the MAP protocol was used and developed for entire tissues. While the first cell expansions were performed in mammalian cell systems and isolated Chlamydomonas centrioles, shortly after U-ExM protocols were applied successfully to protist parasites like Toxoplasma gondii, Trypanosoma brucei, Leishmania major and several Plasmodium species to gain a better understanding of their unique and often underexplored cellular architecture 5, 6, 7, 8, 9, 10. Not only did U-ExM reveal intermolecular information in these parasites, but in the case of T. brucei it also allowed for the first time the localization of two distinct domains within the same protein 11.
Giardia lamblia is a protist parasite inhabiting the small intestine of its host leading to the diarrheal disease giardiasis 12, 13. Giardiasis is of worldwide significance because of high prevalence but also because of the severe cases of dehydration and malnutrition it can cause in small children without access to appropriate treatment 14, 15. Giardia is a well-investigated model organism for its unique cell architecture. The cytoskeleton consists of highly rigid structures giving the cell a clearly polarised shape 16. On the ventral side of the cell, the area of contact to its host, is the ventral disc, a suction cup-like structure to tightly adhere to the wall of the small intestine so it can resist being carried away by peristalsis 17. Apart from the ventral disc, the main components of Giardia’s cytoskeleton are the flagella, a network of actin filaments and the median body, a non-membrane-bound microtubule structure at the dorsal side of the cell, that is thought to be a ready source of components to allow the quick assembly of a replicate ventral disk during mitosis 16, 18, 19.
The composition of membranous organelles in Giardia is just as unique as its cytoskeleton and highly streamlined compared to other Eukaryotes. For example, the peripheral endocytic compartments (PECs), formerly called peripheral vacuoles (PVs) which are localised underneath the plasma membrane are so far Giardia’s only known endocytic compartments and likely involved in protein secretion 20, 21, 22, 23, 24, 25. Dextran coupled to a fluorophore was commonly used to label the lumen of PECs being taken up by these organelles in cyclical fusion events with the plasma membrane 21, 25. The other metabolic marker of PECs is a fluorophore-coupled cholera toxin B 20, 25. Cholera toxin is capable of binding to the plasma membrane of Giardia trophozoites 26, and moves into PECs likely by phospholipid exchange when PECs are fused to the plasma membrane 25, 27. The endoplasmic reticulum (ER) in Giardia is forming a vast network spanning through the whole cell with dense accumulations around the nuclei 28, 29.
Giardia’s cell structures have been extensively studied with super-resolution light microscopy as well as electron microscopy and tomography with a variety of markers for different compartments 24, 25, 30, 31. Halpern et al. 32 were the first to perform ExM of Giardia’s cytoskeleton using a combination of ExM and SIM (structured illumination microscopy). Using these two super-resolution microscopy methods combined, they could show the detailed localisation of two cytoskeleton-associated proteins.
In this study we investigated expansion of cell compartments with different levels of rigidity like the cytoskeleton, the nuclei, the ER, the PECs, and performed bulk protein labelling with NHS-Ester. Furthermore, we include metabolic labelling with cholera toxin B in our protocol. A major challenge of the original post-expansion staining U-ExM protocol from Gambarotto et al. 4 is the length of the protocol that takes up to two days. In this study we demonstrate mostly isotropic 4.5-fold expansion of several different compartments in Giardia cells and present an optimised, shortened, and modular protocol that can be swiftly adjusted to the investigators needs.
RESULTS
Comparison of the original U-ExM protocol with a shortened pre-expansion staining protocol
We adapted a post-expansion protocol from Gambarotto et al., 33 and compared the workflow to a substantially shortened pre-expansion staining protocol for Giardia (Figure 1A-B). The first day of the post-expansion protocol includes the anchoring of the sample (FA/AA treatment), the gelation and denaturation (Figure 1A). On the second day the sample is incubated with the appropriate primary and secondary antibodies followed by the final expansion step. Due to the increased size and introduction of the gel matrix in the sample the incubation times for proper diffusion of the antibodies are longer when compared to regular immunofluorescence assays. The pre-expansion staining approach on the other hand only requires one day for the entire protocol (Figure 1B). For this the cells are prepared as for a regular immunofluorescence staining, providing the advantage that control samples of unexpanded cells can be taken alongside in the same tube. Subsequently, anchoring, gelation and denaturation are performed, each of which are shorter when compared to the post-expansion protocol, which also helps to preserve the fluorophores (see Figure 1 and materials and methods). We introduced an additional DAPI staining step after the gelation to improve the nuclear DNA signal. After one day, the cells are ready to be imaged.
–
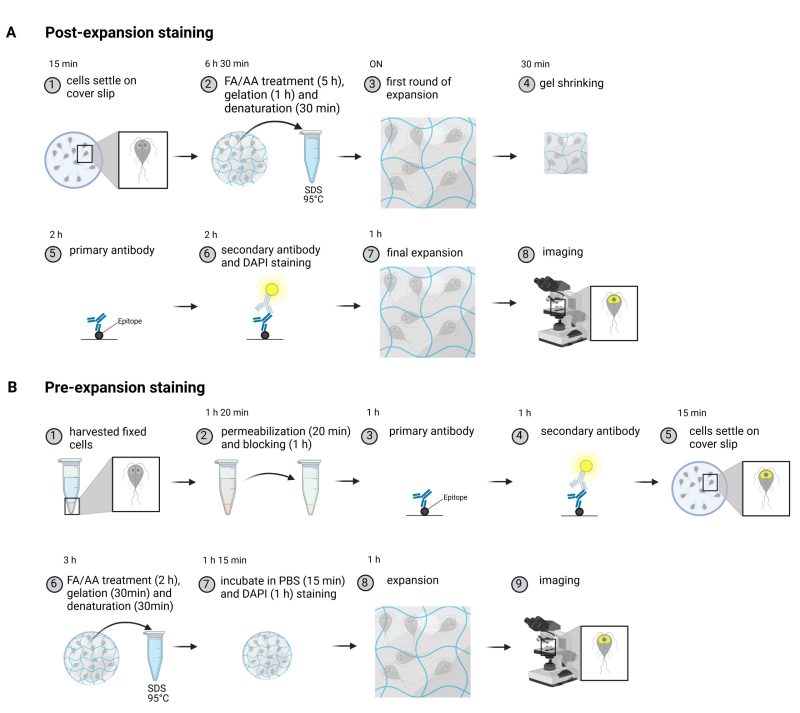 | Protocol of a post-and a substantially shortenedpre-expansion staining method. (A) An overview of the post-expansion staining protocol. Briefly, trophozoites of G. lamblia are left to settle on a cover slip (1). After addition of formaldehyde (FA) and acrylamide (AA), cells are embedded into a polymer and proteins are denatured (2). After a first round of expansion (3), the gels are shrunk in PBS (4). Compared to regular fluorescent assays, antibody incubations are longer for both the primary (5) and secondary antibodies requiring up to three hours per incubation (6). During secondary antibody incubation, DNA is stained with DAPI (6). Following the final expansion (7) gels are imaged (8). (B) Cells are harvested and fixed (1) prior to permeabilization and blocking (2). Epitopes are stained with primary (3) and secondary (4) antibodies before settling cells on a cover slip. Stained cells are then anchored during FA and AA treatment. Subsequently, gelation and denaturation are performed (6). After briefly washing the cells in PBS, the DNA is stained with DAPI (7) and after a final expansion step (8), the sample is imaged (9). Created with BioRender.com. |
Epitope tagging and subsequent antibody staining was used to visualise the ER (GL50803_15383 Peroxiredoxin-1), nuclei (GL50803_27521 Histone H2A), PECs (GL50803_11654 alpha 1-giardin) and the ventral disc (GL50803_4812 beta giardin) (Table 1 and Figure 2). Additionally, DNA was stained with DAPI, the cytoskeleton with anti- alpha tubulin antibodies and we used metabolic labelling with cholera toxin B to visualise the endocytic compartments (Figure 3).
Table 1. Subcellular targets of Giardia endomembrane compartments and corresponding labellin gapproaches.
|
Subcellular target |
Compartment |
Label |
|---|---|---|
|
α-tubulin |
cytoskeleton |
αnti-tubulin antibody/anti-Guinea Pig antibody-647 |
|
GL50803_15383 Peroxiredoxin-1, epitope-tagged |
ER |
αnti-HA antibody/anti-Rat antibody-488 |
|
DNA |
nuclei |
DAPI |
|
GL50803_27521 Histone H2A, epitope-tagged |
nuclei |
αnti-HA antibody/anti-Rat antibody-488 |
|
Ganglioside GM1* |
PM-PECs |
Cholera toxin subunit b coupled to Texas-Red (CTX) |
|
GL50803_11654 alpha 1-giardin, epitope-tagged, episomal |
PECs |
αnti-HA antibody/anti-Rat antibody-488 |
|
GL50803_4812 beta giardin, epitope-tagged |
ventral disc |
αnti-HA antibody/anti-Rat antibody-488 |
*Cholera toxin b was used as a metabolic label for PECs and is known to bindganglioside GM1 although this lipid residue is not characterised in G. lamblia. Abbreviations: ER –endoplasmic reticulum, HA – hemagglutinin, DAPI -4′-6-diamidino-2-phenylindole, PECs – peripheral endocytic compartments. PM –plasma membrane.
Measurements of the nuclei showed an average size of 1.94 µm ± 0.25 (mean ± SD, n = 40) in the unexpanded sample, while the nuclei size for the pre-expansion staining was 8.86 µm ± 0.63 (mean ± SD, n = 40) and for the post-expansion staining protocol 8.43 µm ± 0.69 (mean ± SD, n = 40), giving an expansion factor of 4.6 and 4.3, respectively (Figure 2B). For the ventral disc we measured a mean diameter of 6.85 µm ± 0.33 (mean ± SD, n = 20) in the unexpanded cells. The average diameter of the ventral disc in the pre-expansion staining cells was 31.16 µm ± 1.25 (mean ± SD, n = 20), while it was 30.97 µm ± 1.37 (mean ± SD, n = 20) for the post-expansion staining cells. For the pre-expansion protocol this gives an expansion factor of 4.6 (nuclei), and 4.5 (VD) respectively, while the expansion factor for the post-expansion protocol was 4.3 (nuclei) and 4.5 (VD) (Figure 2B).
–
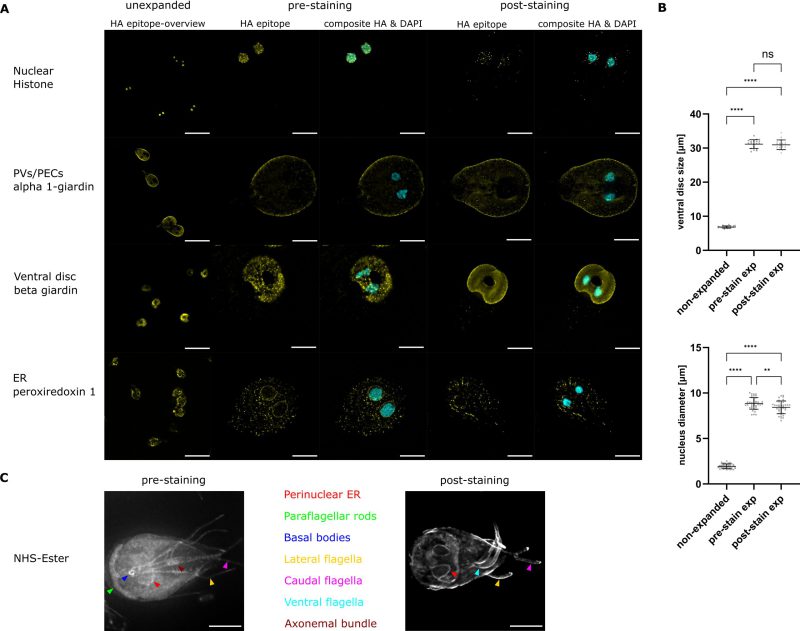 | Comparison of a post- and a substantially shortened pre-expansion staining method used to visualise different cell compartments in G. lamblia. (A) Representative widefield light microscopy images of antibody labelled HA epitope tagged proteins expressed in G. lamblia trophozoites. Displayed are overview images of unexpanded cells in the first column. These cells were split off from the samples that were then further treated in the pre-expansion staining ExM method displayed in this figure. Representative cells of the pre- and post-expansion staining methods are depicted in columns 2-5 with the composite images including DNA stain in cyan. On the left the expected localisation and below the tagged protein is indicated. Signal was enhanced for better visibility. Scale bars: 20µm. (B) Expansion factors measured for unexpanded, pre- and post-expansion stained nuclei and ventral discs (n=20 cells). (C) Maximal Z-projection of widefield images of pre- and post-expanded cells treated with NHS-Ester. Different compartments are colour coded. Scale bars: 20 µm. |
Pre- and post-expansion staining work similarly well in the different compartments tested. Signal localisation, quality, and expansion of all four transgenic lines expressing epitope tagged protein in different compartments were investigated in widefield microscopy. Figure 2 shows the transgenic lines after IFA either unexpanded or expanded using the pre-or post-expansion staining protocols explained in detail above.
In unexpanded conditions all markers were localised as described previously 20. In the pre-expansion staining method where nuclei are expanded by a factor of 4.6, the signal for histone H2A overlaps with the nuclear DAPI stain. Using the post-expansion staining method, the overall H2A signal is weaker than in the pre-expansion staining, and some accumulations are not overlapping with the DNA stain.
Based on previous observations alpha 1-giardin (GL50803_11654) was expected to localise to PECs as well as to the cytosol 20, which is in line with our observations (Figure 2A). Our data show that alpha 1-giardin is predominantly found in the cell periphery, where PECs are localised, but the typical signal in the bare zone of the cell is hardly visible (Figure 2A). The ventral disc marker beta giardin (GL508_4812) is found in punctate accumulations on the ventral disc in the pre-expansion staining, while post-expansion staining results in an even staining of the ventral disc with slight accumulations in the periphery of this structure. For Peroxiredoxin-1, a marker of the ER, we find the characteristic accumulations surrounding the nuclei in the unexpanded and in both expansion protocols, however it is less obvious in the post-expansion than in the pre-expansion approach.
Additionally, NHS ester 488 dye was used in pre- and post-expansion staining protocols to visualise different compartments and organelles. While in both protocols the cells expand isotropically and allow for inspection of the perinuclear ER, the ventral, caudal and lateral flagella, only the pre-expansion protocol allows the visualisation of the paraflagellar rods, the basal bodies and the axonemal bundle (Figure 2C).
The pre-expansion staining protocol can be used for metabolic labelling of PECs and be combined with the post-expansion staining protocol
Peripheral endocytic compartments were labelled with the membrane label cholera toxin B (Figure 3A) and then treated with the pre-expansion staining ExM protocol. Subsequently, the cytoskeleton of the cells was stained with anti-tubulin antibodies to test if both protocols can be combined. Tubulin staining using the pre-expansion staining protocol did not result in any detectable signal while in post-expansion staining, tubulin antibodies stain Giardia’s cytoskeletal structures like the ventral disc, especially the lateral crest/disc margin, axostyle, median bodies and flagella very well (Figure 3B). This also shows that these structures despite their rigid nature are still expanded and do not seem to be damaged in the process. If the tips of the flagella did stay intact is difficult to assess but they were at least partly preserved. Even though not being very strong, cholera toxin signal survives the whole pre- and post-expansion staining procedure and results in the expected typical PECs signal in the cell periphery as well as the bare zone as described in previous studies.
–
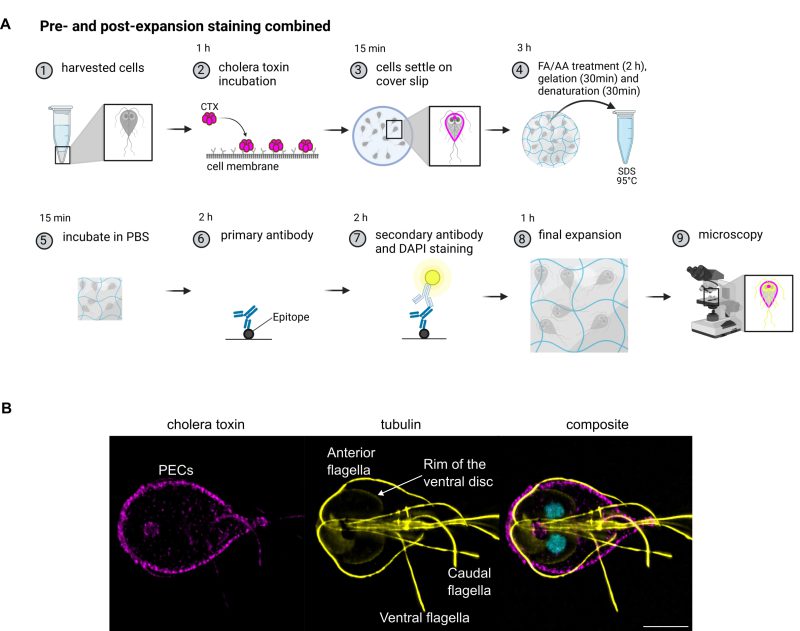 | Cholera toxin-dependent metabolic labelling of peripheral endocytic compartments inExM. The workflow of metabolic cholera toxin labelling with subsequent antibody staining is depicted in (A). Briefly, harvested cells (1) are incubated with cholera toxin (CTX) which binds to glycans on cell membranes (2). Cells are allowed to settle on a cover slip (3) before performing the anchoring with formaldehyde (FA) and acrylamide (AA). After gelation and denaturation (4), the gels are briefly washed in PBS (5) before performing tubulin staining with primary (6) and secondary antibodies together with DAPI (7). An example image showing the CTX staining in magenta, tubulin in yellow and a composite including DAPI staining is depicted in part (B). Signal was enhanced for better visibility and colours are displayed in cmyk rather than original fluorophore colour. Scale bar 5 µm. Created with BioRender.com. |
DISCUSSION
Proteins with low expression levels are problematic in both pre- and post-expansion staining ExM protocols
The indicated marker proteins (Table 1) expressed by transgenic lines were chosen for their previously investigated localisation and good expression levels. However, transgenic lines with expression levels that are low but still sufficient for microscopy on unexpanded cells, like for example alpha 1-giardin, underperform in both pre- and post-expansion staining in ExM. Even though a localisation to the cell periphery is still visible, the typical signal from PECs localised in the bare zone of the cell is not visible in our expanded samples. We observed localisation to the cell periphery as well as the bare zone in a previous study performed on the exact same cell line using confocal microscopy 20. The previously observed cytosolic pool of this protein seems to be less enriched after expansion, likely a result of enlarging the volume of the cell considerably but keeping the number of labelled molecules the same as in unexpanded cells. Comparing the signal found in the expanded alpha 1-giardin line to the other used PECs marker, metabolic labelling with cholera toxin, the PECs signal is much crisper in the cholera toxin samples.
Applied protocols result in larger expansion than seen previously and confirm expansion of rigid cytoskeletal structures
ExM was previously used to study the cytoskeleton of Giardia in great detail with tubulin and ventral disc protein staining 32. In this study, we focused our attention on different marker proteins expressed by transgenic lines in different compartments of the Giardia cell. However, we also performed staining with tubulin to investigate if pre- and post-expansion staining can be combined for the same sample. Overall, we achieved a very similar expansion factor for the pre- and post-expansion staining of nuclei and ventral discs (see Figure 2B). The deviation in expansion factor of less than 10 % between the structurally very different compartments (nuclei and ventral disc) in combination with the integrity of the polarised cell shape suggests an overall isotropic expansion of the sample in both protocols. The observed increase in expansion when compared to the previous study by Halpern et al. 32 might be a consequence of the different chemical approach that was used for anchoring (MA-NHS instead of AA), the different gel composition and the enzymatic treatment of the sample (Proteinase K).
The newly established protocol allows short processing times and modular application
The main advantage of the protocols presented here is the significant reduction of handling time. While the U-ExM protocol, originally introduced by Gambarotto et al. 4, 33 requires two full working days, we were able to half this time in our pre-expansion staining protocol, requiring only one day. To investigate the ultrastructure of the expanded cells, we also performed NHS-ester 488 staining for both protocols. While the post-expansion protocol appears to have more detailed distinctions for different compartments in the cell, it is only able to visualise the perinuclear ER, and the ventral, caudal and lateral flagella, while the pre-expansion protocol additionally gives insights into compartments like paraflagellar rods, the basal bodies and the axonemal bundle. Overall, for both the pre- and the post-expansion protocol we could show that the cells seem isotropically expanded. Minimization of incubation times for fixation, anchoring (FA/AA treatment), gelation and denaturation led to no significant deterioration of cell expansion factor or the integrity of the sample.
Overall, we observed that cytoskeletal structures like the ventral disc could be better visualised using the post-expansion protocol. For example, in the case of beta giardin the signal in post-expansion labelled cells was crisper and stronger and more evenly distributed compared to the pre-expansion labelled samples but the ventral disc was still visible in pre-expansion labelling. In tubulin we could not find any detectable signal in the pre-expansion labelled samples. This is astonishing as in the protocol used by Halpern et al. 32 the samples were pre-labelled before expansion and resulted in a very crisp cytoskeletal signal. This might have to do with the antibody used, the primary antibody used in Halpern et al. 32 was an anti-acetyl alpha tubulin antibody (clone 6-11B-1) and could be further investigated by testing different alpha tubulin antibodies.
Taken together, some epitopes seem to function better in pre-expansion staining and others in post-expansion staining. As the here presented protocols can be combined in a modular fashion, the visualisation of each marker can be optimised individually.
MATERIALS AND METHODS
Cell culturing and harvesting
Trophozoites of Giardia lamblia wild type (WBA C6 (ATCC 50803)) as well as transgenic lines (transfection and construct synthesis according to 20) were grown in axenic culture as described in previously published protocols 23, 25, 34. All investigated transgenic constructs (Table 1) carried a hemagglutinin (HA) tag at the C-terminus and were expressed under their putative endogenous promoters. Cells were incubated at 37°C in standard Giardia growth medium 35. Passaging of the cultures was performed when cells had reached confluency, every two to three days. For the performed immunofluorescence assays (IFAs), one tube (NuncTM polystyrene culture tube by Thermo Fisher Scientific of 12 ml volume) was grown per investigated transgenic line or of the wild type respectively. To detach the cells, tubes were put on ice for approximately 30-60 minutes and then hit on a padded surface to release all cells from the tube wall before they were pelleted at 900 x g for 10 minutes. Cells were washed in PBS (phosphate-buffered saline) and put in 1.5 ml Eppendorf tubes.
Immunofluorescence assays
Samples were treated as in previously established protocols for IFAs in Giardia 23, 25, 34. Cells were harvested as described above and fixed for two hours in 3% formaldehyde solution (Sigma) in PBS (Figure 1B step 1). Samples were then washed with PBS and quenched in 0.1 M glycine in PBS for five minutes before they were permeabilized for 20 minutes in 2% bovine serum albumin (BSA) + 0.2 % Triton-X-100 in PBS (Figure 1B step 2). After permeabilization, the samples were blocked in 0.1% Tween20 diluted in PBS containing 2% BSA (PBS-T) for one hour (Figure 1B step 2). Cells were incubated with 100 µl rat-derived monoclonal anti-HA primary antibody (dilution 1:250; Roche) in PBS containing 2% BSA (Figure 1B step 3), washed three times in PBS for 10 minutes and then incubated in 100 µl goat-derived anti-Rat IgG (H+L) secondary antibody conjugated to Alexa Fluor 488 (AF488) (dilution 1:250; Thermo Fisher) in PBS containing 2% BSA (Figure 1B step 4). For NHS-Ester staining, cells were incubated with 100 µl DyLight NHS Ester dye (dilution 1:100; 46403, Thermo Fisher) in PBS containing 2% BSA. Antibody incubations were performed at room temperature for one hour each and samples were washed three times in PBS-T after both incubations. For microscopy of unexpanded cells, half of the cell pellet was taken out at this point and put in ca. 30 µl Vectashield (Reactolab) containing 4′-6-diamidino-2-phenylindole (DAPI). 4 µl of cell solution was applied to a glass slide, covered with 22 mm x 22 mm coverslips and sealed with nail polish. Imaging was performed under the same conditions as described below. For the rest of the cell pellet the pre-expansion staining microscopy protocol was performed as described in the next section.
Pre-expansion staining microscopy protocol
The following section contains a detailed description of the pre-expansion staining protocol (antibody staining performed before gelation) visualised in Figure 1B. Coverslips (12 mm, CB00120RA120MNZ0, Epredia) were functionalized with poly-D-lysine (A3890401, Gibco) at room temperature for 30 minutes and subsequently washed three times with deionized water. Pre-stained cells (stained according to immunofluorescence assay protocol above) were spread on functionalized coverslips and left to settle at room temperature in the dark for 15 minutes (Figure 1B step 5). Samples were kept in the dark during all steps. For anchoring, cells were incubated with 0.7% formaldehyde (FA, 36.5–38%, F8775, SIGMA) and 1% acrylamide (AA, 40%, A4058, SIGMA) diluted in PBS at 37°C for 2 hours (Figure 1B step 6). Gelation was performed as previously described, however incubation times were shortened to better preserve fluorescent signal of pre-stained samples. The gelation solution was prepared freshly: monomer solution containing 19% sodium acrylate (SA, 97–99%, 408220, SIGMA), 10% acrylamide (AA, 40%, A4058, SIGMA) and 0.1% N,N’-methylenebisacrylamide (BIS, 2%, M1533, SIGMA) was supplemented with 0.5% ammonium persulfate (APS, 17874, Thermo Fisher) and 0.5% tetramethylethylenediamine (TEMED, 17919, Thermo Fisher). Gelation was performed on ice. One drop of 35 µl gelation solution was placed on a parafilm in a pre-cooled humidity chamber and cells were incubated 5 minutes on ice before final gelation at 37°C for 30 minutes (Figure 1B step 6). Gels were detached from coverslips by gently shaking in 1 ml denaturation buffer (200 mM SDS, 200 mM NaCl and 50 mM Tris in deionized water, pH 9) at RT for 15 minutes. Subsequently, gels were incubated at 95°C in denaturation buffer for 30 minutes (Figure 1B step 6). After washing the gels three times 5 minutes in PBS, the DNA was stained with 5 µg/ml DAPI (D9542-5MG, SIGMA) diluted in PBS with gentle agitation for one hour (Figure 1B step 7). Samples were then expanded in deionized water for one hour (Figure 1B step 8). If required, the protocol can be easily combined with post-expansion staining.
Post-expansion staining microscopy protocol
The post-expansion staining (antibody staining performed after gelation) was performed according to 33, and is illustrated in Figure 1A. Cells are settled on functionalized coverslips for 15 minutes at room temperature and then anchored with 0.7% formaldehyde (FA, 36.5–38%, F8775, SIGMA) and 1% acrylamide (AA, 40%, A4058, SIGMA) diluted in PBS at 37°C for 5 hours (Figure 1A, step 2). The gelation solution was prepared freshly: monomer solution containing 1 % sodium acrylate (SA, 97–99%, 408220, SIGMA), 10% acrylamide (AA, 40%, A4058, SIGMA) and 0.1% N,N’-methylenebisacrylamide (BIS, 2%, M1533, SIGMA) was supplemented with 0.5% ammonium persulfate (APS, 17874, Thermo Fisher) and 0.5% tetramethylethylenediamine (TEMED, 17919, Thermo Fisher). Gelation was performed on ice. One drop of 35 µl gelation solution was placed on a parafilm in a pre-cooled humidity chamber and cells were incubated 5 minutes on ice before final gelation at 37°C for one hour. Gels were detached from coverslips by gently shaking in 1 ml denaturation buffer (200 mM SDS, 200 mM NaCl and 50 mM Tris in deionized water, pH 9) at RT for 15 minutes. Subsequently, gels were incubated at 95°C in denaturation buffer for 30 minutes (Figure 1A, step 2). After denaturation, gels were placed in deionized water and incubated overnight for the first round of expansion (Figure 1A, step 3). The next day, gels were incubated in PBS for 30 minutes (Figure 1A, step 4) and then stained with 1 mL of primary antibody for 2 hours (Figure 1A, step 5): rat-derived monoclonal anti-HA primary antibody (dilution 1:250; Roche) in PBS containing 2% BSA; DyLight NHS Ester dye (dilution 1:100; 46403, Thermo Fisher) in PBS containing 2% BSA. Gels were then washed three times in PBS for 10 minutes and incubated with secondary antibodies (goat-derived anti-Rat IgG (H+L) secondary antibody conjugated to Alexa Fluor 488 (AF488), dilution 1:250; Thermo Fisher) for 2 hours in PBS containing 2% BSA and 5 µg / ml DAPI (D9542-5MG, SIGMA). Gels were then washed three times for 10 minutes in PBS and incubated in deionized water for the final expansion for one hour (Figure 1A, step 7).
Metabolic labelling of PECs with ChlTxB and cytoskeletal labelling of tubulin -combining pre- and post-expansion staining
Giardia wild type trophozoites were harvested as described above but not yet fixed. Instead, cells were resuspended in 50 µl culture medium containing cholera toxin B (1 µg/4 µl), Alexa Fluor™ 594 Conjugate (Cat. No C22842, Thermo Fisher) and incubated for one hour at 37°C (Figure 3) to allow cholera toxin to bind to the plasma membrane and enter the PECs (Figure 3A, step 2). The cells were subsequently washed twice in PBS and treated according to the pre-expansion staining protocol above. Cholera toxin B stained cells were spread on functionalized coverslips and left to settle at RT in the dark for 15 minutes. Cells were incubated with 0.7% formaldehyde (FA, 36.5–38%, F8775, SIGMA) and 1% acrylamide (AA, 40%, A4058, SIGMA) diluted in PBS at 37°C for 2 hours for anchoring (Figure 3A, step 4). The gelation solution was prepared freshly as described above. One drop of 35 µl gelation solution was placed on a parafilm in a pre-cooled humidity chamber and cells were incubated 5 minutes on ice before final gelation at 37°C for 30 minutes. Samples were put in 1 ml denaturation buffer (200 mM SDS, 200 mM NaCl and 50 mM Tris in deionized water, pH 9) at RT for 15 minutes under gentle shaking, leading to the detaching of the gels from the coverslips. Gels were then incubated at 95°C in denaturation buffer for 30 minutes. Gels were incubated briefly in PBS and cut with a razor blade. One-eight of the gel was incubated in primary guinea pig α-tubulin antibodies (dilution 1:125, AA345, Geneva Antibody Facility) in PBS containing 2% BSA at 37°C for two hours. After washing the gels three times 10 minutes in PBS, they were incubated in secondary anti-guinea pig antibodies conjugated with Alexa fluorophore 647 (dilution 1:125, 150187, Abcam) in PBS containing 2% BSA and 5 µg / ml DAPI at 37°C for 2 hours. After washing the gels three times 10 minutes in PBS, samples were expanded in deionized water for one hour.
Mounting and image acquisition
After the final expansion, the gels were cut and mounted on poly-D-lysine functionalized 35 mm glass-bottom dishes (D35-20-1.5-N, Cellvis, 35 mm glass bottom dish with 20 mm micro-well #1.5 cover glass). These closed sample holders strongly reduced evaporation and shrinkage of the gels. Images were acquired using the 60x oil objective (NA = 1.4) of a NIKON Ti 2 CREST V3 in wide field mode. The microscope was equipped with a Hamamatsu Flash 4.0 camera and a celesta light engine. Following parameters were used: z step size was set to 0.3 µm and pixel size was 108 nm. Images were deconvolved using Huygens software and subsequently analysed with ImageJ. Expansion factors were calculated based on the ratios of maximal and minimal diameters of nuclei and ventral discs of unexpanded and expanded giardia cells (n = 20 cells measured). The data was analysed using GraphPad Prism version 9.5.0 (www.graphpad.com). Statistical analysis was performed using a One-way ANOVA test (*P ≤ 0.05; **P ≤ 0.0; ***P ≤ 0.001; ****P ≤ 0.0001).
References
-
Multiplexed and scalable super-resolution imaging of three-dimensional protein localization in size-adjustable tissues. Nat Biotechnol 34(9): 973–981. doi: 10.1038/nbt.3641
-
Protein-retention expansion microscopy of cells and tissues labeled using standard fluorescent proteins and antibodies. Nat Biotechnol 34(9): 987–992. doi: 10.1038/nbt.3625
-
Imaging cellular ultrastructures using expansion microscopy (U-ExM) Nat Methods 16(1): 71–74. doi: 10.1038/s41592-018-0238-1
-
Characterization of the novel mitochondrial genome segregation factor TAP110 in Trypanosoma brucei. J Cell Sci 134(5): 254300. doi: 10.1242/jcs.254300
-
Hamel V (2021). Expansion microscopy provides new insights into the cytoskeleton of malaria parasites including the conservation of a conoid. PLOS Biol 19(3): 3001020. doi: 10.1371/JOURNAL.PBIO.3001020
-
Expansion microscopy facilitates quantitative super-resolution studies of cytoskeletal structures in kinetoplastid parasites. Open Biol 11(9): 210131. doi: 10.1098/RSOB.210131
- Soldati-Favre D (2020). Essential function of the alveolin network in the subpellicular microtubules and conoid assembly in Toxoplasma gondii. Elife 9: 1–22. doi: 10.7554/ELIFE.56635
- Pre-gelation staining expansion microscopy for visualisation of the Plasmodium liver stage. J Cell Sci 136(22): jcs261377. doi: 10.1242/JCS.261377
- Ultrastructure expansion microscopy in Trypanosoma brucei. Open Biol 11 (10): 210,132–210,132. doi: 10.1098/RSOB.210132
- Single p197 molecules of the mitochondrial genome segregation system of Trypanosoma brucei determine the distance between basal body and outer membrane. Proc Natl Acad Sci U S A 119(40): 2204294119. doi: 10.1073/pnas.2204294119
- Variation in Giardia: Implications for Taxonomy and Epidemiology. Adv Parasitol 58: 69–137. doi: 10.1016/S0065-308X(04)58002-8
- The experimental transmission of human intestinal protozoan parasites. II. Giardia lamblia cysts given in capsules. Am J Hyg 59(2): 209–222. doi: 10.1093/OXFORDJOURNALS.AJE.A119634
- Giardiasis – why do the symptoms sometimes never stop? Trends Parasitol 26(2): 75–82. doi: 10.1016/J.PT.2009.11.010
- Platts-Mills J A (2016). Giardia: A pathogen or commensal for children in high-prevalence settings. Curr Opin Infect Dis 29(5): 502–507. doi: 10.1097/QCO.0000000000000293
- Imaging and Analysis of the Microtubule Cytoskeleton in Giardia. Methods Cell Biol 97(10): 97017–97026. doi: 10.1016/S0091-679X(10)97017-9
- Fine structure of the ventral disk apparatus and the mechanism of attachment in the flagellate Giardia muris. J Cell Sci 13(1): 11–41. doi: 10.1242/JCS.13.1.11
- The structural organization of Giardia intestinalis cytoskeleton. Adv Parasitol 107: 1–23. doi: 10.1016/BS.APAR.2019.08.003
- The median body of Giardia lamblia: an ultrastructural study. Biol Cell 96(9): 735–746. doi: 10.1016/J.BIOLCEL.2004.05.006
- A core UPS molecular complement implicates unique endocytic compartments at the parasite-host interface in Giardia lamblia. Virulence 14(1): 2174288. doi: 10.1016/J.BIOLCEL.2004.05.006
- Five facts about Giardia lamblia. PLOS Pathog 14(9): 1007250. doi: 10.1016/J.BIOLCEL.2004.05.006
- Roles of Phosphoinositides and Their binding Proteins in Parasitic Protozoa. Trends Parasitol 35(12): 996–1008. doi: 10.1016/J.PT.2019.08.008
- Phosphoinositide-binding proteins mark, shape and functionally modulate highly-diverged endocytic compartments in the parasitic protist Giardia lamblia. PLOS Pathog 16(2): 1008317. doi: 10.1371/JOURNAL.PPAT.1008317
-
Combined nanometric and phylogenetic analysis of unique endocytic compartments in Giardia lamblia sheds light on the evolution of endocytosis in Metamonada. BMC Biol 20(1): 1–23. doi: 10.1186/S12915-022-01402-3
- Static Clathrin Assemblies at the Peripheral Vacuole-Plasma Membrane Interface of the Parasitic Protozoan Giardia lamblia. PLOS Pathog 12(7): 1005756. doi: 10.1371/JOURNAL.PPAT.1005756
- Changes in intestinal fluid and mucosal immune responses to cholera toxin in Giardia muris infection and binding of cholera toxin to Giardia muris trophozoites. Infect Immun 50(1): 243–249. doi: 10.1128/IAI.50.1.243-249.1985
- Glucosylceramide synthesis inhibition affects cell cycle progression, membrane trafficking, and stage differentiation in Giardia lamblia. J Lipid Res 51(9): 2527. doi: 10.1194/JLR.M003392
- A Contiguous Compartment Functions as Endoplasmic Reticulum and Endosome/Lysosome in Giardia lamblia. Eukaryot Cell 8(11): 1665–1676. doi: 10.1128/ec.00123-09
- Identification of endoplasmic reticulum in the primitive eukaryote Giardia lamblia using cryoelectron microscopy and antibody to BiP. J Cell Sci 109(7): 1909–1917. doi: 10.1242/JCS.109.7.1909
- A Detailed, Hierarchical Study of Giardia lamblia’s Ventral Disc Reveals Novel Microtubule-Associated Protein Complexes. PLoS One 7(9): 43783. doi: 10.1371/JOURNAL.PONE.0043783
- Inheritance of the reduced mitochondria of Giardia intestinalis is coupled to the flagellar maturation cycle. BMC Biol 19(1): 1–20. doi: 10.1186/s12915-021-01129-7
-
Hybrid Structured Illumination Expansion Microscopy Reveals Microbial Cytoskeleton Organization. ACS Nano 11(12): 12677–12686. doi: 10.1021/acsnano.7b07200
- Ultrastructure expansion microscopy (U-ExM). Methods Cell Biol 161: 57–81. doi: 10.1016/BS.MCB.2020.05.006
- Unexpected organellar locations of ESCRT machinery in Giardia intestinalis and complex evolutionary dynamics spanning the transition to parasitism in the lineage Fornicata. BMC Biol 19(1): 1–23. doi: 10.1186/s12915-021-01077-2
- The transcriptional response to encystation stimuli in Giardia lamblia is restricted to a small set of genes. Eukaryot Cell 9(10): 1566–1576. doi: 10.1186/s12915-021-01077-2
ACKNOWLEDGMENTS
The authors acknowledge Dr. Sandro Käser and Ado Crnovrsanin for discussions and assistance in revising the manuscript and Dr. Corina Wirdnam for Giardia cell culture. Microscopy was performed on equipment supported by the Microscopy Imaging Center (MIC) of the University of Bern, Switzerland.
Funding for this project was provided by Swiss National Science Foundation grant number PR00P3_179813 awarded to CF and SNF grant 179454 and Uniscientia Foundation grant awarded to TO.
COPYRIGHT
© 2024

Expansion of metabolically labelled endocytic organelles and cytoskeletal cell structures in Giardia lamblia using optimised U- ExM protocols by Jetishi et al. is licensed under a Creative Commons Attribution 4.0 International License.