
Back to article: Quantifying yeast lipidomics by high-performance thin-layer chromatography (HPTLC) and comparison to mass spectrometry-based shotgun lipidomics
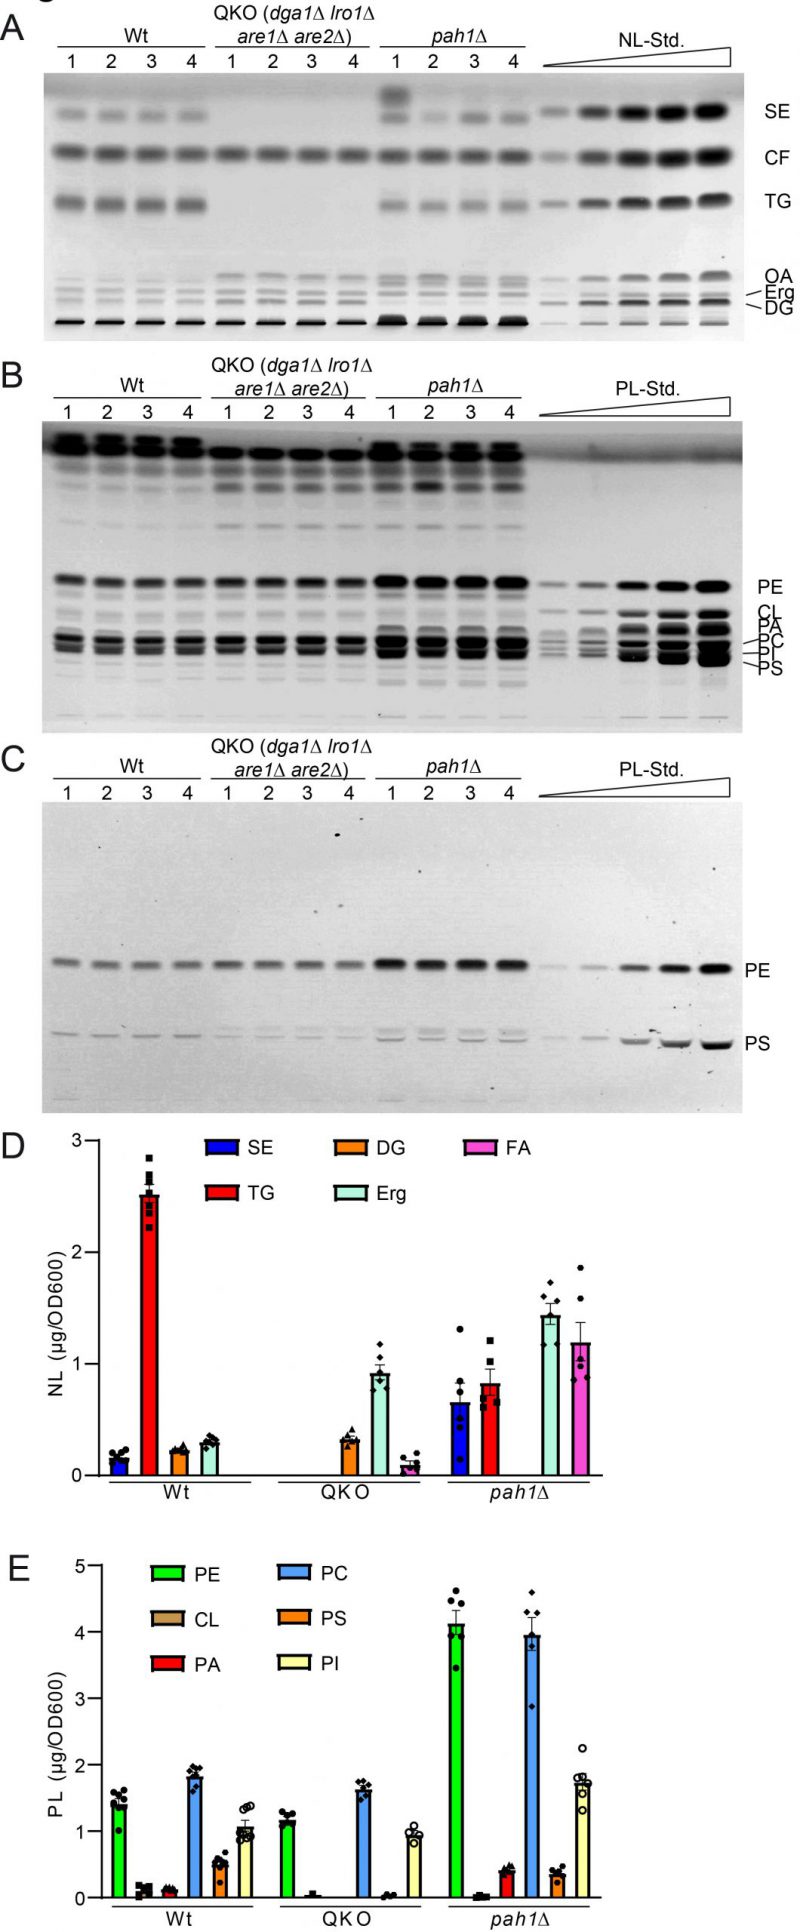
FIGURE 5: Further validation of HPTLC-based lipidomic method by quantification of yeast strains with known lipidomic changes. (A) HPTLC plate showing neutral lipid separation of wildtype (wt), dga1Δ lro1Δ are1Δ are2Δ (QKO), and pah1Δ each in quadruple. (B, C) HPTLC plate showing phospholipid separation, derivatised using Primulin (B) visualising all lipids and ninhydrin (C), which visualizes PS and PE only. (D, E) Lipidomic quantification of neutral lipids (D) and phospholipid classes (E).