
Back to article: Quantifying yeast lipidomics by high-performance thin-layer chromatography (HPTLC) and comparison to mass spectrometry-based shotgun lipidomics
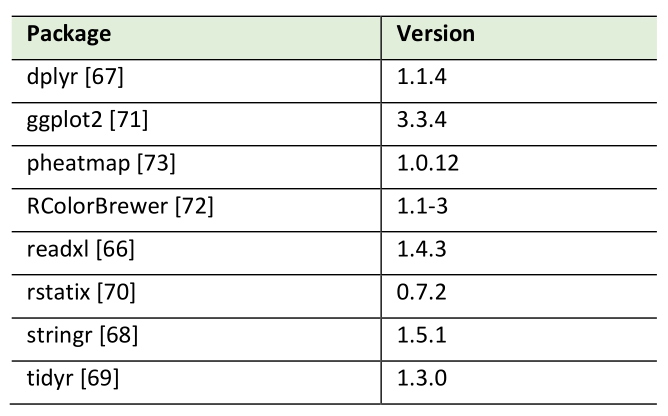
Table 2. R packages used in this study.
66. Wickham H, and Bryan J (2023). readxl: Read Excel Files. R package version 1.4.3, https://readxl.tidyverse.org, https://github.com/tidyverse/readxl
67. Wickham H, François R, Henry L, Müller K, and Vaughan D (2023). dplyr: A Grammar of Data Manipulation. R package version 1.1.4, https://github.com/tidyverse/dplyr, https://dplyr.tidyverse.org
68. Wickham H (2023). stringr: Simple, Consistent Wrappers for Common String Operations. R package version 1.5.1, https://github.com/tidyverse/stringr, https://stringr.tidyverse.org
69. Wickham H, Vaughan D, and Girlich M (2023). tidyr: Tidy Messy Data. R package version 1.3.1, https://github.com/tidyverse/tidyr, https://tidyr.tidyverse.org
70. Kassambara A (2023). rstatix: Pipe-Friendly Framework for Basic Statistical Tests. R package version 0.7.2, https://rpkgs.datanovia.com/rstatix/
71. Wickham H (2016). ggplot2: Elegant Graphics for Data Analysis. Springer-Verlag New York. R package version 3.3.4, https://ggplot2.tidyverse.org
72. Neuwirth E (2022). RColorBrewer: ColorBrewer Palettes. R package version 1.1-3, https://colorbrewer2.org/
73. Kolde R (2019). pheatmap: Pretty Heatmaps. R package version 1.0.12, https://CRAN.R-project.org/package=pheatmap