
Back to article: Predictable regulation of survival by intratumoral microbe-immune crosstalk in patients with lung adenocarcinoma
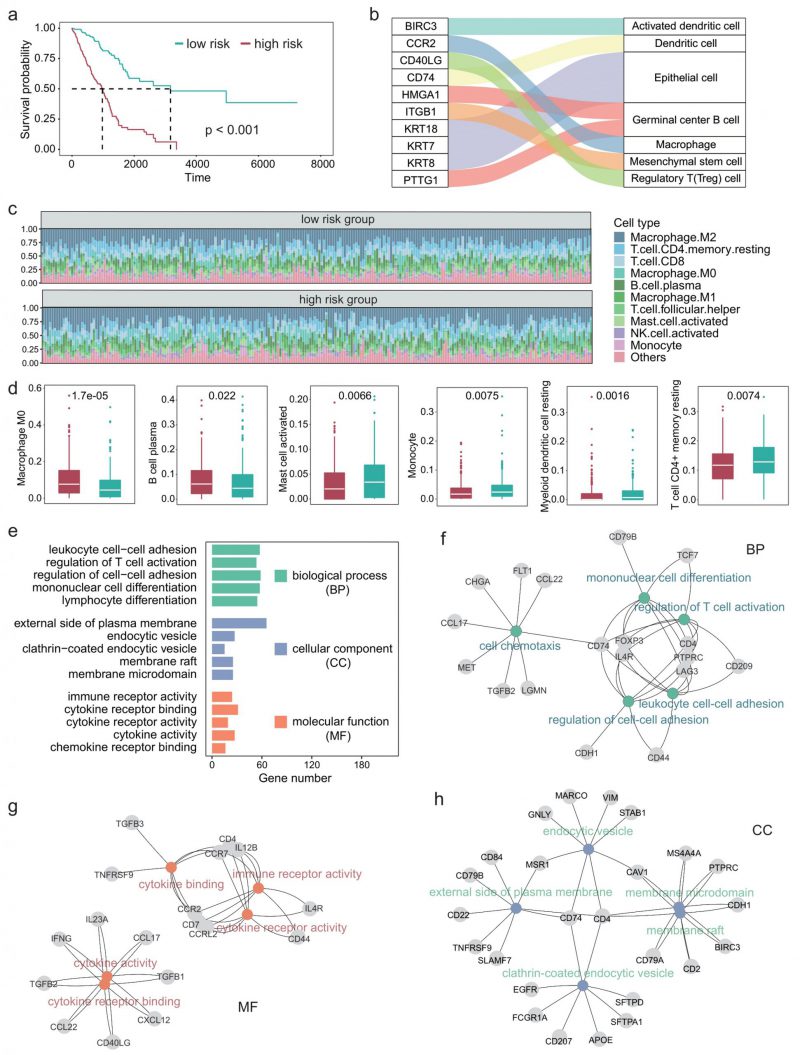
FIGURE 3: Tumor immune microenvironment and related functions are associated with survival in LUAD patients. (A) Survival curve in different risk score groups obtained by COX regression analysis. (B) Sankey plot showing the correlation between immune cells and the ten genes most associated with survival. (C) Relative abundance of the immune cell components in each patient. (D) Boxplot showing the differences in the abundance of immune cells between the high- and low-risk group. Wilcoxon test was used to perform the statistical test. (E) Five GO terms with the largest number of genes in each class. (F-H) The most significantly enriched GO terms in each class, along with the corresponding genes.