Back to article: Aminoglycoside resistance profile and structural architecture of the aminoglycoside acetyltransferase AAC(6’)-Im
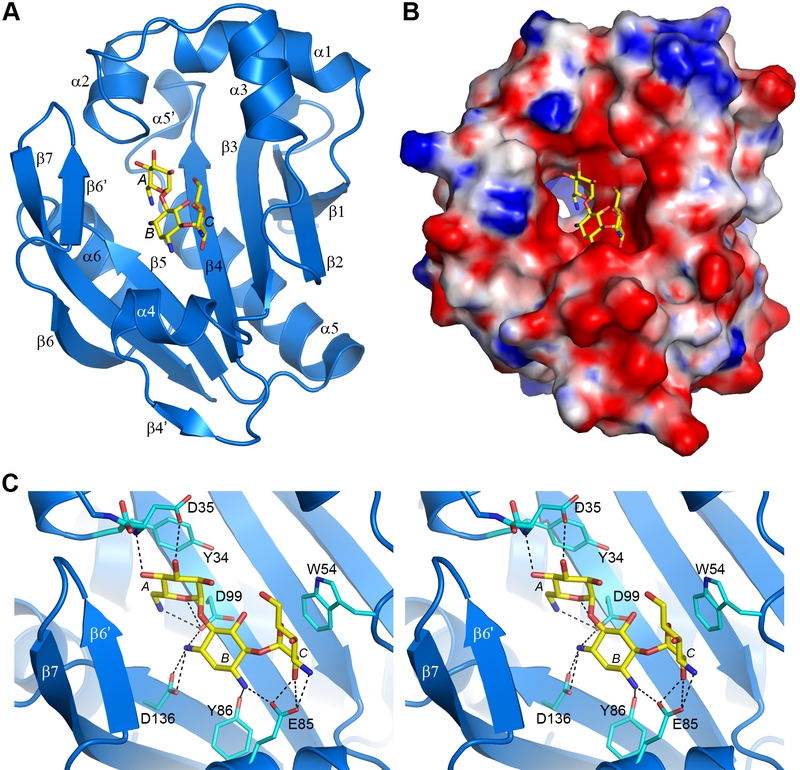
FIGURE 3: The kanamycin A complex of AAC(6’)-Im. (A) Ribbon representation of AAC(6’)-Im (blue) with the bound kanamycin A shown as yellow sticks. The secondary structure nomenclature used throughout the paper is indicated. (B) Electrostatic surface representation of AAC(6’)-Im, with the surface potentials ranging from -5 kT/e (red) to +5 kT/e (blue). The bound kanamycin A is shown as yellow sticks. (C) Stereoview of the kanamycin A binding site of AAC(6’)-Im, showing the hydrogen bonding interactions (black dashed lines) of kanamycin A (yellow sticks) with the protein side chains (cyan sticks).

