Back to article: Identification of Ftr1 and Zrt1 as iron and zinc micronutrient transceptors for activation of the PKA pathway in Saccharomyces cerevisiae
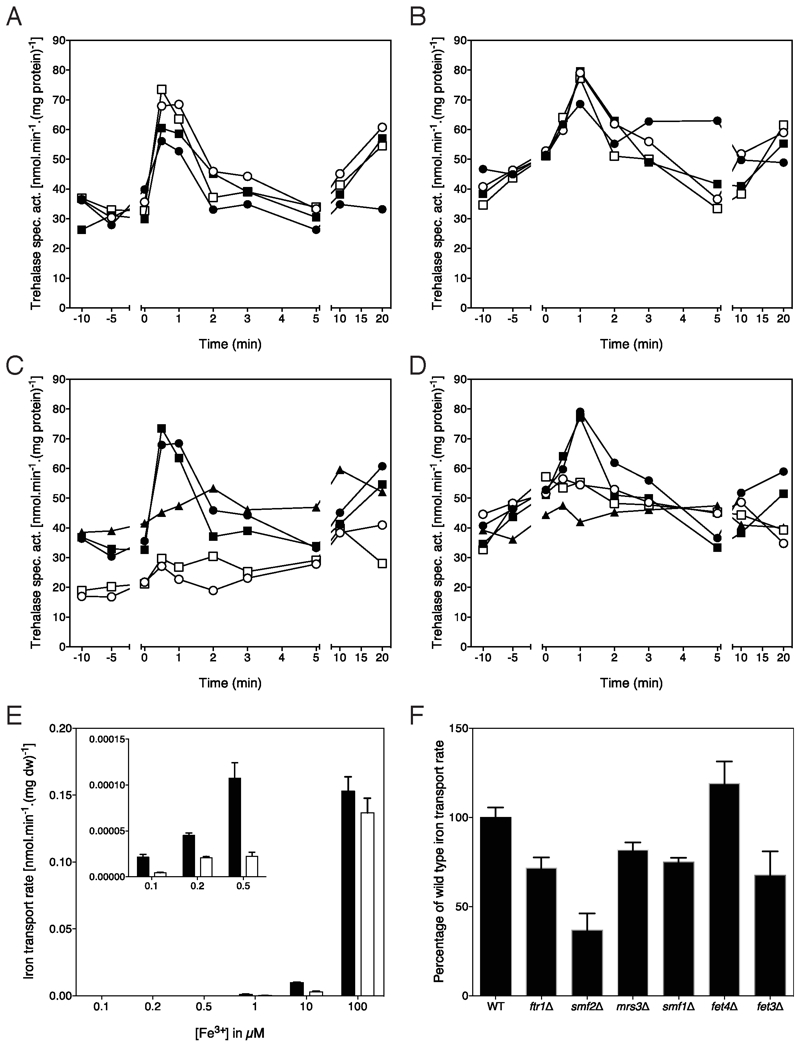
FIGURE 4: Re-addition of iron to iron-deprived cells triggers Ftr1-dependent activation of the PKA target trehalase.
(A) Activation of trehalase in the wild type strain after addition of different concentrations of FeCl3 to cells deprived for iron for two days in the presence of the BPS chelator. 100 nM (closed circles), 1 μM (closed squares), 10 μM (open circles) and 100 μM (open squares) FeCl3.
(B) Activation of trehalase in the wild type strain after addition of different concentrations of FeCl2 to cells deprived for iron for two days in the presence of the BPS chelator. 100 nM (closed circles), 1 μM (closed squares), 10 μM (open circles) and 100 μM (open squares) FeCl2.
(C) Activation of trehalase in wild type, ftr1Δ and fet3Δ strains after addition of different concentrations of FeCl3 to cells deprived for iron for two days in the presence of the BPS chelator. 100 μM and 1 μM. Wild type, 1 μM (closed circles) and 100 μM (closed squares) FeCl3; ftr1Δ, 1 μM (open circles) and 100 μM (open squares) FeCl3 and fet3Δ, 100μM FeCl3 (closed triangles).
(D) Activation of trehalase in wild type, ftr1Δ and fet3Δ strains after addition of different concentrations of FeCl2 to cells deprived for iron for two days in the presence of the BPS chelator. Wild type, 1 μM (closed circles) and 100 μM (closed squares) FeCl2; ftr1Δ, 1 μM (open circles) and 100 μM (open squares) FeCl2 and fet3Δ, 100μM FeCl2 (closed triangles).
(A-D) All experiments were performed 3-5 times with consistent results; representative results are shown.
(E) Uptake of different concentrations of Fe55Cl3 in the wild type (black bars) and ftr1Δ (white bars) strains, n = 2. The inset shows the uptake at the lower concentrations in enlarged format.
(F) Uptake of 100 μM Fe55Cl3 in strains with a deletion of a single metal ion transporter gene, expressed as % of the uptake in the wild type strain, n = 2.

