
Back to article: Mutational analysis of fructose-1,6-bis-phosphatase FBP1 indicates partially independent functions in gluconeogenesis and sensitivity to genotoxic stress
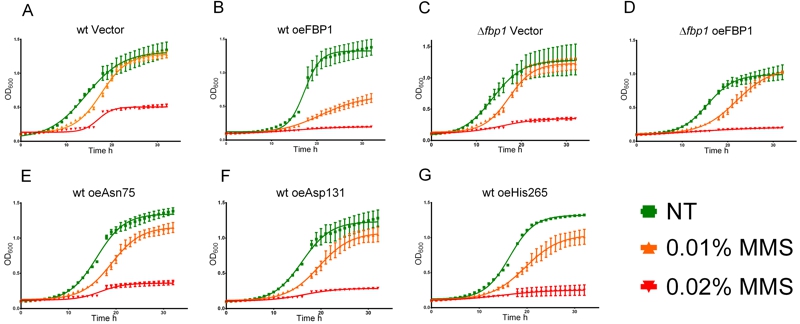
FIGURE 5: Growth curves upon MMS treatment.
Figures A to G feature the growth curves of the non-treated and MMS-treated (0.01% and 0.02%) yeast strains in liquid SD-Ura medium. Curves feature the increasing OD600 values over-time at 30°C with intermittent shaking, error bars represent SD, N = 3. (A) wt Vector, (B) wt oe FBP1, (C) fbp1∆ Vector, (D) fbp1∆ oe Fbp1p, (E) wt oeAsn75, (F) wt oe Ser133, (G) wt oe His265.