Back to article: The interaction between herpes simplex virus 1 genome and promyelocytic leukemia nuclear bodies (PML-NBs) as a hallmark of the entry in latency
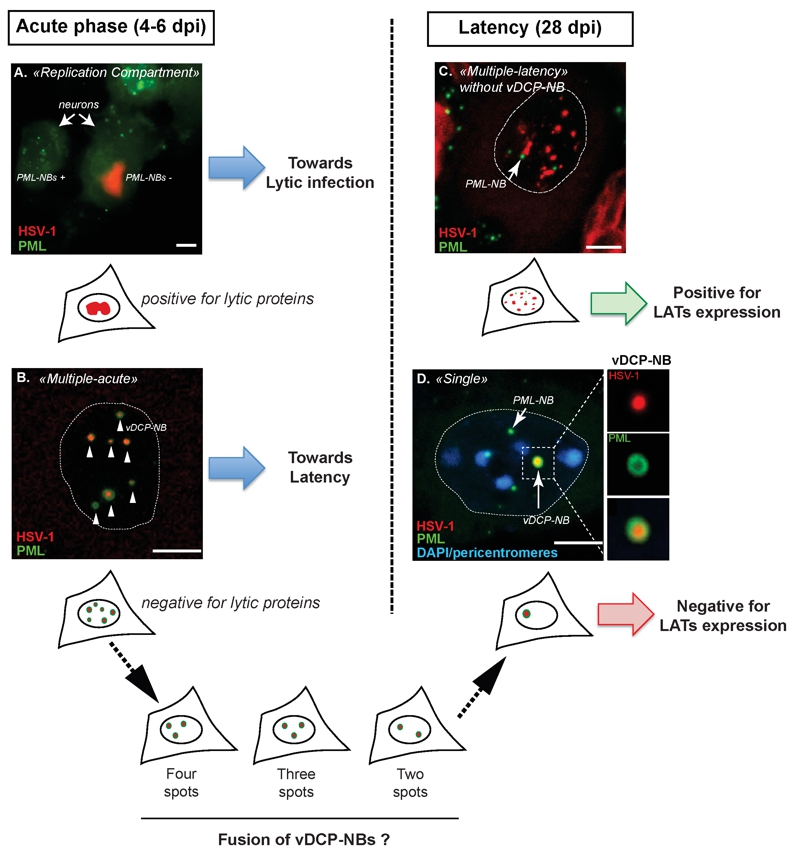
FIGURE 1: Major patterns of herpes simplex virus (HSV-1) genome distribution in infected trigeminal ganglion (TG) neurons during acute infection (4-6 dpi) and latency (28 dpi) in mice. HSV-1 genomes (red) are detected by fluorescence in situ hybridization (FISH) together with the detection of the PML protein (green) by immunofluorescence. During acute infection virus genomes adopt two main patterns: replication compartments (RC) or multiple-acute (MA).
(a) RC are visualized by the detection of a “cloud” of viral genomes spread within the nucleoplasm. In RC-containing neurons, PML-NBs are no longer detected (compare infected right neuron with uninfected left neuron) and expression of lytic proteins could be detected.
(b) MA is characterized by the detection of discrete spots of viral genomes surrounded by the PML protein. These structures were defined as “viral DNA-containing PML-NBs” (vDCP-NBs). No lytic proteins were detected in MA-containing neurons. During latency (from 28 dpi onwards), two other viral genome patterns are detectable: multiple-latency (ML) or single (S).
(c) ML is distinguishable from MA based on at least three criteria: (i) the viral genome spots are usually smaller; (ii) the viral genome spots detected in the nucleus are more numerous; and (iii) most of the time ML-containing neuron do not contain any vDCP-NB.
(d) S corresponds to the detection of only one spot of viral genome in the infected neuron, forming a unique vDCP-NB. The S pattern could result from the fusion of the multiple vDCP-NBs observed in MA-containing neurons during the period of latency establishment (between 6 and 28 dpi), since in vivo, intermediate patterns of 4-3-2 vDCP-NBs-containing neurons were observed around 11 to 14 dpi. Cartoons are present below each image for a general representation of the pattern. Blue colour in (d) represents DAPI staining.
Dpi, days post infection. Bars represent 10 µm. Figure 1D was partly reproduced from a previous article by the author (Lomonte P. Virologie 2014; 18(3): 170-9. doi:10.1684/vir.2014.0569) who have obtained the agreement of the publisher to use it in the present publication.

