Research Articles:
Microbial Cell, Vol. 10, No. 3, pp. 63 - 77; doi: 10.15698/mic2023.03.793
D-Serine reduces the expression of the cytopathic genotoxin colibactin
1 School of Immunity and Inflammation, College of Medical, Veterinary and Life Sciences, University of Glasgow, United Kingdom.
2 IRSD, INSERM, INRAE, Université de Toulouse, ENVT, Toulouse, France.
3 CHU Toulouse, Hôpital Purpan, Service de Bactériologie-Hygiène, Toulouse, France.
4 School of Microbiology, University College Cork, National University of Ireland, Cork, Ireland.
# JCH and SS contributed equally to this work.
Keywords: E. coli, colibactin, expression, genotoxin, cell cycle.
Abbreviations:
CRC – colorectal cancer,
DSB – double strand break,
EHEC – enterohaemorrhagic E. coli,
ICL – interstrand cross-link,
LEE - locus of enterocyte effacement,
UPEC - uropathogenic E. coli.
Received originally: 15/12/2022 Received in revised form: 08/02/2023
Accepted: 09/02/2023
Published: 06/03/2023
Correspondence:
Andrew J. Roe, School of Immunity and Inflammation, College of Medical, Veterinary and Life Sciences, University of Glasgow, United Kingdom; Andrew.roe@glasgow.ac.uk
Nicky O’Boyle, School of Microbiology, University College Cork, National University of Ireland, Cork, Ireland; NOboyle@ucc.ie
Conflict of interest statement: All authors declare that they have no conflicts of interest.
Please cite this article as: Jennifer C. Hallam, Sofia Sandalli, Iris Floria, Natasha C. A. Turner, Min Tang-Fichaux, Eric Oswald, Nicky O’Boyle and Andrew J. Roe (2023). D-Serine reduces the expression of the cyto-pathic genotoxin colibactin. Microbial Cell 10(3): 63-77. doi: 10.15698/mic2023.03.793
Abstract
Some Escherichia coli strains harbour the pks island, a 54 kb genomic island encoding the biosynthesis genes for a genotoxic compound named colibactin. In eukaryotic cells, colibactin can induce DNA damage, cell cycle arrest and chromosomal instability. Production of colibactin has been implicated in the development of colorectal cancer (CRC). In this study, we demonstrate the inhibitory effect of D-Serine on the expression of the pks island in both prototypic and clinically-associated colibactin-producing strains and determine the implications for cytopathic effects on host cells. We also tested a comprehensive panel of proteinogenic L-amino acids and corresponding D-enantiomers for their ability to modulate clbB transcription. Whilst several D-amino acids exhibited the ability to inhibit expression of clbB, D-Serine exerted the strongest repressing activity (>3.8-fold) and thus, we focussed additional experiments on D-Serine. To investigate the cellular effect, we investigated if repression of colibactin by D-Serine could reduce the cytopathic responses normally observed during infection of HeLa cells with pks+ strains. Levels of γ-H2AX (a marker of DNA double strand breaks) were reduced 2.75-fold in cells infected with D-Serine treatment. Moreover, exposure of pks+ E. coli to D-Serine during infection caused a reduction in cellular senescence that was observable at 72 h post infection. The recent finding of an association between pks-carrying commensal E. coli and CRC, highlights the necessity for the development of colibactin targeting therapeutics. Here we show that D-Serine can reduce expression of colibactin, and inhibit downstream cellular cytopathy, illuminating its potential to prevent colibactin-associated disease.
INTRODUCTION
The gastrointestinal tract is a complex environment, where the composition and abundance of metabolites and signalling molecules can be affected by the host diet and physiology, the microbiota, and invading pathogens [1]. How bacteria sense and respond to these signals is crucial for their survival and successful colonization within the host. Most of the colonizers are commensal organisms which live mutualistically, however, certain pathogenic strains can outcompete resident bacteria by utilizing host metabolites. Indeed, competition in this environment goes beyond contending for food, as metabolites have also been shown to influence gene expression and drive evolutionary change amongst bacteria residing in the gut [2].
–
The composition of the human diet greatly influences the availability of metabolites within the gastrointestinal environment, as many indigestible components provide substrates for the resident microflora. An often-overlooked group of metabolites are the D-amino acids, of which the average dietary consumption is estimated at 100 mg/d [3]. D-amino acids are found naturally in foods such as fruits and vegetables [4], however, higher concentrations are more commonly associated with fermented and processed foods, including aged cheeses and breakfast cereals [3]. D-amino acids are also an important source of energy for the resident microflora. Indeed, bacteria can utilize these for essential processes including supporting growth, regulating spore germination, and in cell wall synthesis, where D-Alanine and D-Glutamate are routinely found as components of the peptidoglycan sacculus [5]. Furthermore, D-amino acids have been found to have a profound effect on gene expression and studies have shown they can manipulate the expression of virulence genes in diverse bacteria [6][7][8]. The concentrations of these D-amino acids are often dependent on the site within the host. For example, D-Serine is found at 1 μM in the gut and at 1 mM in the urine [9], a substantial difference that we believe could play a role in regulating niche-specificity [10]. In order to metabolize these molecules, bacteria must possess specialized catabolic enzymes [11][12][13][14][15][16]. In the case of D-Serine, certain bacteria encode a specialized tolerance locus, enabling them to exploit D-Serine as a carbon source, facilitating colonization at nutrient deficient extraintestinal sites. The uropathogenic Escherichia coli (UPEC), commonly possess this capability. UPEC strains can traverse through the gastrointestinal tract and colonize the bladder, where carbon sources are scarce, but D-Serine concentrations are high [17][18]. UPEC, and many other E. coli that belong to the B2 phylogroup, commonly encode a D-Serine tolerance locus, dsdCXA. This locus encodes a D-Serine deaminase (DsdA), a D-Serine inner membrane transporter (DsdX) and an essential LysR-type transcriptional regulator (LTTR) (DsdC) that regulates the system [16]. Indeed, the role of dsdCXA is to prevent UPEC strains from succumbing to inhibitory concentrations of D-Serine in the urinary tract, by converting the substrate to ammonia and pyruvate [9][16][19]. While there have been conflicting reports surrounding the role of D-Serine in regulating virulence in UPEC [9][20], recent transcriptome analysis has demonstrated that D-Serine exhibits the ability to modulate the expression of genes beyond the dsdCXA locus in both dsd– and dsd+ strains [21].
–
Recently, we described the transcriptional response to D-Serine in strains from three distinct E. coli pathotypes; enterohaemorrhagic E. coli (EHEC), neonatal meningitis associated E. coli (NMEC) and UPEC [21]. Strikingly, the results revealed a unique transcriptional profile for each pathotype with not a single differentially expressed gene shared between all three strains. Interestingly, the transcriptional response in UPEC highlighted differential expression in a cluster of genes involved in a non-ribosomal peptide synthetase pathway. This peptide synthetase pathway, termed the pks island, was first described in 2006, where E. coli encoding this 54 kb genomic island were implicated with inflicting a genotoxic insult on eukaryotic cells [22]. The pks island is comprised of 19 genes which encode the machinery for biosynthesis and transportation of colibactin, the peptide-polyketide hybrid compound responsible for exerting genotoxic activity [23]. The pks island was first identified in extraintestinal E. coli (ExPEC) strains, with colibactin described as a bona fide virulence factor in several studies [24][25][26][27]. Carriage of the pks island has also been described in around 34% of commensal E. coli strains belonging to the B2 phylogenetic group [23][27][28], and in other members of the Enterobacteriaceae including Citrobacter koseri, Klebsiella pneumoniae and Enterobacter aerogenes [23].
–
Recently, there has been a dramatic increase in interest in colibactin research, largely due to the identification of an association between colibactin activity and the development of colorectal cancer (CRC). This association arises from the ability of colibactin to cause DNA double-strand breaks (DSBs), DNA crosslinks and chromosome instability in eukaryotic cells [29][30][31][32]. E. coli harbouring the pks island have been isolated from biopsy specimens of CRC patients and have been found to be capable of establishing persistent colonization, inducing inflammation, and triggering tumour growth in these tissues [33][34][35]. Indeed, recent whole genome analysis of pks+ infected organoids revealed a distinct mutational signature in adenine rich motifs. This mutational signature was also observed in CRC tissues, and it was confirmed that the mutations were the result of colibactin exposure [36][37]. CRC is the third most frequently diagnosed cancer [38] and attributes to around 610,000 deaths per year worldwide [35]. Therefore, colibactin-producing E. coli represent an urgent public health matter. Here, we compared the effects of a comprehensive panel of naturally-occurring amino acids – comprising the 20 proteinogenic L-amino acids and their corresponding D-enantiomers – on the expression of colibactin synthesis genes. Consistent with our recent study [21], we found that exposure to D-Serine induced a significant downregulation of the pks gene cluster. Further, we tested the effects of D-Serine during infection of HeLa cells and found that treatment of pks harbouring E. coli resulted in a dampening of the genotoxic effect exerted upon eukaryotic cells. Considering this research, we propose D-Serine has potential to be used as a novel therapeutic to control expression of colibactin in pks-encoding E. coli strains.
RESULTS
Colibactin biosynthesis is downregulated in response to D-serine
The host metabolite D-Serine has been shown to selectively affect the expression of virulence factors in E. coli pathotypes that do not possess the intact dsdCXA locus [10]. However, little is known of the effects on gene expression in pathotypes found in D-Serine rich environments such as the bladder. Therefore, this prompted an investigation into how exposure to D-Serine implicated gene expression in E. coli that encoded the complete dsdCXA locus. Previous work examining the transcriptome of CFT073 exposed to D-Serine revealed many significant differentially expressed genes throughout the genome, but of particular interest was the downregulation of several genes encoding proteins involved in the synthesis of the genotoxin colibactin [21]. Comparison of read data from D-Serine treated (red) and untreated control (black) CFT073, indicate that treatment results in a downshift in expression of several colibactin synthesis genes (Fig. 1A). The log2-transformed fold changes observed are indicated in Fig. 1B. The most significant reductions were identified for genes clbB, I, G, C, H and K respectively. Full details for fold changes and P-values can be found in Table S1. Interestingly, these genes belong to four (clbB, clbC-G, clbH and clbI-N) of seven putative transcriptional units of the clb locus [39] and encode enzymes essential for production of precolibactin, the precursor to cytotoxic colibactin [40], suggesting D-Serine can interfere with the manufacture of active colibactin in CFT073.
–
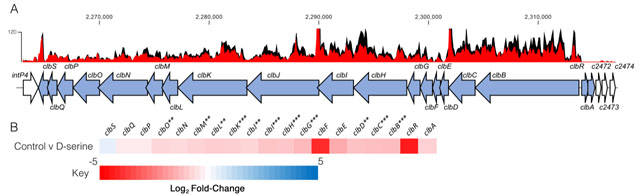 |
FIGURE 1: Transcriptome analysis of CFT073 reveals downregulation of the colibactin biosynthesis operon in response to D-Serine. Using read data from our previous transcriptomic study [21], we constructed track maps of the clb locus in CFT073 in the presence and absence of D-Serine. (A) Read density in the colibactin biosynthesis locus for representative samples of the untreated control (black) and D-Serine treated (red) CFT073 is indicated. Read tracks were normalized, exported from CLC Genomics Workbench and overlayed. Genomic coordinates are displayed above the read tracks and the corresponding genes within the colibactin biosynthesis operon (blue) beneath. (B) Heat map indicating the EdgeR calculated log2 relative fold changes for each gene in the colibactin biosynthesis locus with corresponding colour key beneath. False discovery rate-corrected P values are indicated with significantly differentially expressed genes with *, ** and *** indicating P < 0.05, 0.01 and 0.001, respectively. |
–
Expression of the genotoxin colibactin is affected by D-and L-amino acids in both CFT073 and Nissle 1917
We next investigated if the downregulation of the colibactin genes was a unique property of D-Serine, by comparing a comprehensive panel of L- and D-amino acids under the same growth conditions. Real-time quantitative polymerase chain reaction (RT-qPCR) was used to determine expression of the pks encoded gene clbB; chosen as it encodes a hybrid non-ribosomal peptide synthetase/type I polyketide synthase (NRP-PKS) that is integral to colibactin synthesis [41]. Exposing CFT073 to L-Aspartic acid, L-Isoleucine, and L-Selenocysteine led to the most significant decrease in clbB expression; reductions of 7.52, 8.84, and 6.17-fold were observed, respectively (Fig. 2A). In addition, expression of clbB was significantly reduced in nine of 20 D-amino acids tested, with the most significant observations recorded for expression of clbB in D-Cysteine (0.11) and D-Serine (0.32), P = 0.009 and 0.006, respectively (Fig. 2B). Interestingly, of the seven L-amino acids showing a significant reduction, Isoleucine was the only amino acid to show repression of clbB with both L- and D-enantiomers, highlighting the distinction in responses to L- and D-amino acids. Next, we selected some of the amino acids which displayed a significant effect on clbB expression in CFT073, and tested them with the commensal E. coli strain, Nissle 1917. This strain was chosen based on its commensal origin and clinical significance as a probiotic [42][43]. Furthermore, it has successfully been used in the characterization of the colibactin-associated phenotype observed in HeLa cells and recently the genotoxicity of Nissle 1917 was demonstrated in the gut lumen of mice [44][45], while CFT073 is precluded from such analysis as the cytopathic effects of colibactin are often confounded by haemolysin activity [46]. In response to the L- and D-amino acids tested (Fig. 2C), significant downregulation of clbB in Nissle 1917 was observed for seven of 17 amino acids tested. Interestingly, L-Selenocysteine yielded the largest decrease, with clbB expression reduced 5.64-fold compared to the control (P = 0.029). However, it should be noted that growth of both CFT073 and Nissle 1917 was strongly inhibited in the presence of L-Selenocysteine (Fig. S1), likely accompanied by stress-associated transcriptomic perturbations that may have indirectly altered clbB expression that is not observed with other amino acids. The second most significant decrease was observed for D-Serine where a 3.81-fold reduction was observed, (P = 0.036). Relative expression and P-values for all amino acids tested can be found in Table S2 for CFT073, and S3 for Nissle 1917. Our RT-qPCR results corroborated the findings of our previous RNA-Seq study [21] and confirmed that D-Serine repressed expression of the colibactin synthesis genes in CFT073.
–
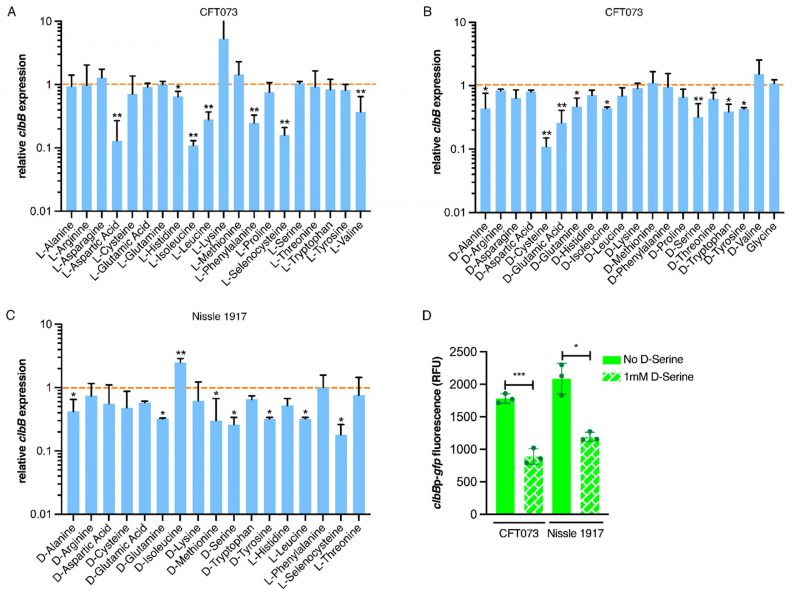 | FIGURE 2: Expression of colibactin is modulated by L- and D-amino acids. Relative clbB expression was measured by RT-qPCR. CFT073 was grown in M9 minimal media supplemented with amino acids to a final concentration of 1 mM for 5 h. (A) Shows relative expression in the presence of L-amino acids and (B) indicates expression in the presence of D-amino acids. The orange dashed line indicates baseline expression with bars above and below this line representing up and downregulation, respectively. Statistical significance was determined from three biological replicates using an unpaired Student's t-test with, * and ** indicating significance, P < 0.05 and 0.01, respectively. (C) Amino acids significantly affecting clbB expression in CFT073 were tested in Nissle 1917 under the same growth conditions as discussed above. (D) clbBp:gfp reporter activity in MEM-HEPES in the presence and absence of 1 mM D-serine. Bacteria were sampled at 4 h post-inoculation, clbB expression was measured as GFP/OD600. Columns represent mean +/- standard error of the means (SEM) with individual experimental observations indicated by data points. Statistical significance was assessed using a paired Student's t-test with *, ***, denoting P < 0.05 and 0.0001, respectively. |
–
Expression of clbB was further assessed by using a gfp reporter assay on bacteria grown in MEM-HEPES media. This was important to test because subsequent assays assessing DNA damage mediated by colibactin in eukaryotic cells would require growth in tissue culture media. Expression of clbB reduced by 2.00 and 1.75-fold in CFT073 and Nissle 1917 respectively (Fig. 2D), when cultured in MEM-HEPES. Moreover, to test a wider panel of clinically relevant strains, we used a group of nine E. coli phylogroup B2 isolates obtained from bloodstream infections of Scottish patients [47]. Genome data was accessed from the European Nucleotide Archive (PRJEB12513) to demonstrate the nine isolates carried complete pks clusters and expression of colibactin was assessed using the clbBp:gfp reporter. The assay showed significant (P <0.05) repression of clbB transcription when 1 mM D-serine was added to the media in every isolate tested (Fig. S2). These data, showing repression of colibactin by D-serine in both prototypic and clinical isolates, suggest a common mechanism underpinning this phenotype that is widely held across pks carrying E. coli.
–
D-Serine-induced repression of colibactin reduces DNA damage
Colibactin exerts a genotoxic effect in infected eukaryotic cells through the formation of DNA interstrand cross-links (ICLs) and DSBs [29]. As exposure to D-Serine caused a downregulation in the colibactin synthesis genes, we hypothesized that D-Serine would be capable of limiting the formation of DNA ICLs. To investigate this, we exposed linear DNA to live pks+ E. coli cultured in M9 minimal media alone or supplemented with 1 mM D-Serine and assessed colibactin-associated cross-linking activity. Upon exposure of linear DNA to Nissle 1917 and CFT073, strong cross-linking activity was apparent, as observed by an increase in molecular weight consistent with DNA duplex formation. However, upon the addition of D-Serine, a marked reduction in cross-linking activity was observed (Fig. 3A). Quantification of DNA ICLs by densitometry revealed that the addition of D-Serine reduced the cross-linking of DNA by 2.83 and 1.39-fold, by Nissle 1917 and CFT073, respectively (Fig. 3B). The formation of colibactin-associated ICLs in eukaryotic cells activates the ICL repair response pathway and results in the production of ICL-dependent DNA DSBs. Therefore, as exposure to D-Serine reduced cross-linking activity in linear DNA, we hypothesized that treatment with D-Serine could also lead to a reduction of DNA DSBs in HeLa cells infected with pks+ E. coli. To examine DSBs, we infected HeLa cells with Nissle 1917 and measured levels of γ-H2AX, a variant of the histone family H2A, that becomes phosphorylated in response to DNA DSBs. Cell lysates were extracted 4 h post-infection and detection of γ-H2AX was determined by immunoblotting (Fig. 3C). To quantify the level of H2AX phosphorylation, normalized γ-H2AX signal intensities from three experiments were compared (Fig. 3D). Nissle 1917 infected cells exhibited a 6.41-fold (P = 0.006) increase in normalized γ-H2AX signal compared with uninfected cells. Inclusion of D-Serine during infection with Nissle 1917 resulted in a 2.75-fold reduction in γ-H2AX signal intensity compared to cells infected with untreated Nissle 1917 (P = 0.003). Interestingly, D-Serine did not reduce γ-H2AX signal intensity upon infection with DH10B pBAC-pks, suggesting that D-Serine activity requires factors specific to the natural colibactin-carrying isolates described here. To confirm that D-Serine acted specifically on colibactin, DC10B was employed as a pks– E. coli strain. γ-H2AX signal intensity indicated that levels of phosphorylation were similar to that of uninfected cells and the addition of D-Serine did not significantly change levels of phosphorylation. Taken together, these results indicate that D-Serine induced repression of natively encoded colibactin during infection of HeLa cells and led to a reduction in the formation of DSBs as measured by decreased phosphorylation of H2AX.
–
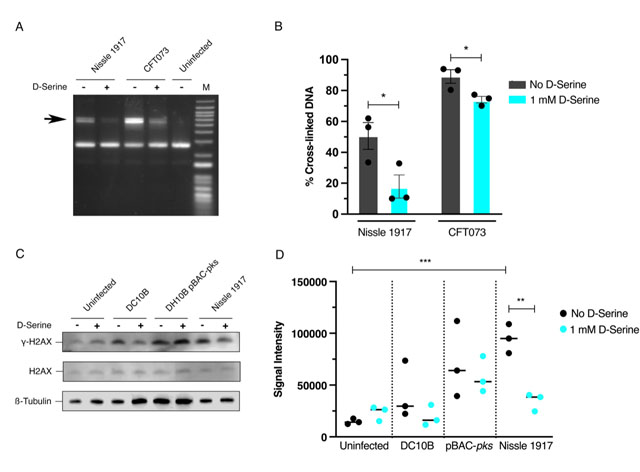 |
FIGURE 3: Repression of colibactin by D-Serine reduces cross-link formation, and DNA damage in Hela cell infection. (A and B) Nissle 1917 and CFT073 were cultured for 5 h in M9 minimal media alone (-) or in media supplemented with 1 mM D-Serine (+) before 1.5 × 10⁶ CFU was exposed to linearized plasmid DNA for 40 min. The DNA was extracted, and cross-linking activity was determined by electrophoresis in denaturing conditions. (A) DNA cross-link formation of linearized plasmid DNA exposed to Nissle 1917 and CFT073 was visualized after migration under alkaline denaturing conditions. M, DNA size marker (1 kB plus DNA ladder, Invitrogen). (B) The percentage of the DNA signal in the upper, cross-linked band (indicated by the arrow in panel A) relative to the total DNA signal. Signal intensities were quantified using ImageJ for three independent experiments and statistical significance was assessed by unpaired Student's t-test with, * indicating P = < 0.01. (C and D) HeLa cells were infected for 4 h with live pks+ and pks- E. coli with a multiplicity of infection (MOI) of 400 bacteria per cell or left uninfected. Infections were performed in wells containing MEM-HEPES alone (-) or with media supplemented with 1 mM D-Serine (+). (C) Immunoblot analysis of cell lysates extracted 4 h post infection. Phosphorylated histone (γ-H2AX) was used as an indicator of double stranded DNA breaks and total histone (H2AX) was used as an internal control. β-Tubulin was used as a loading control for cell lysates. DH10B pBAC-pks and DC10B were used as positive and negative controls, respectively. (D) Signal intensities of bands were measured using LI-COR Image Studio software. γ-H2AX signals were corrected to account for any variation in loading using β-Tubulin signal intensity. Experimental signal was normalized so that the mean signal intensity of the eight samples was equivalent for each experiment. The experiment was carried out in triplicate. Columns represent mean +/- SEM with individual experimental observations indicated by data points. Statistical significance was assessed by unpaired Student's t-test with, ** and *** indicating P < 0.01 and 0.001, respectively. |
–
DSB lesion formation is reduced upon exposure of pks+ E. coli to D-Serine
In response to DNA DSBs, factors involved in the DNA damage response (DDR), including γ-H2AX, accumulate at sites of damage temporarily [48]. These so-called nuclear foci are formed by γ-H2AX which can spread over megabases along the DNA flanking the breakage site [49] and can be visualized using labelled antibodies under fluorescence microscopy [50]. Therefore, we investigated the effects of D-Serine on the formation of DNA DSBs at the subcellular level by visualizing nuclear foci positive for γ-H2AX [51]. HeLa cells were infected with pks+ E. coli and then incubated with anti-γ-H2AX monoclonal antibody, labelled with an Alexa Fluor 555 secondary antibody, and visualised by confocal microscopy. We observed intense punctate staining of γ-H2AX after infecting cells with untreated Nissle 1917 indicative of the induction of DNA DSBs. Exposure to D-Serine led to the formation of fewer nuclear lesions/foci with nuclei resembling those of uninfected cells. The number of foci remained unchanged in cells infected with DH10B pBAC-pks both in the presence and absence of D-Serine (Fig. 4A). To investigate the heterogeneity in the response of individual HeLa cells to D-Serine during infection γ-H2AX phosphorylation was measured by flow cytometry. This revealed that D-Serine reduced the number of γ-H2AX positive cells by 2.5-fold (54.6% vs 21.1% of cells γ-H2AX +ve). However, exposure to D-Serine did not fully return levels of γ-H2AX fluorescence to that of the uninfected cells (Fig. 4B).
–
 |
FIGURE 4: D-Serine reduces nuclear foci observed in HeLa cells. HeLa cells were infected for 4 h with E. coli Nissle 1917 or DH10B hosting BAC-pks (MOI = 400). Infections were performed with and without the addition of 1 mM D-Serine to the growth media. At 8 h post infection, cells were washed, fixed, and stained with anti-γ-H2AX antibody. (A) Cells were examined by confocal microscopy for DNA in cyan and phosphorylated histone H2AX protein in magenta. Images of uninfected, and pks+ infected cells are shown, scale bar = 50 μm. (B) Intracellular levels of phosphorylated histone H2AX were measured by flow cytometry 8 h after infection. Dot plots reveal the percentage of viable cells fluorescing in the γ-H2AX channel, 100k events were analysed for each sample. |
–
Exposure to D-Serine reduces colibactin-associated cellular senescence
Cellular senescence has been described as an irreversible state of cell cycle arrest, often in response to DNA damage [52]. This phenomenon is associated with colibactin and is observed when mammalian cells are infected with live pks+ E. coli [22]. Exposure to D-Serine led to a reduction in H2AX phosphorylation, demonstrating that colibactin-associated DNA damage was reduced by D-Serine (Fig. 4). Therefore, we aimed to show that exposure to D-Serine would also result in a reduction in downstream cellular senescence. HeLa cells were infected with live pks+ E. coli for 4 h, before cells were treated with gentamicin for 72 h. Cell morphology was observed by staining actin filaments with Phalloidin-Alexa Fluor 555 and using fluorescence microscopy for visualization (Fig. 5A). Colibactin-producing E. coli have been distinguished by their ability to induce megalocytosis in cultured eukaryotic cells, a phenotype associated with senescence, characterized by progressive enlargement of the cell body, and the nucleus, and the abolishment of mitosis [23]. In the absence of D-Serine, cells infected with Nissle 1917 displayed the characteristic cytopathic effect, with cellular and nuclear enlargement being apparent (Fig. 5). However, upon exposure to D-Serine, cells infected with Nissle 1917 had a cell morphology that was markedly more like that of the uninfected control. Consistent with our findings described earlier (Fig. 3), D-Serine treatment did not result in a decrease in the senescence-associated morphological alterations observed in DH10B pBAC-pks. The mean cell area was determined for three independent replicates using image analysis software, CellProfiler (Fig. 5B). Cell enlargement increased 2.60-fold (from 1209.52 to 3140.90 μm) during infection with Nissle 1917, however, upon addition of D-Serine, the mean cell area decreased to 666.62 μm (P < 0.01). Individual cell area measurements indicate the variable extent of cell enlargement observed across the three experiments (Fig. 5C). Overall, these results demonstrated that reduction of colibactin expression through exposure to D-Serine reduced both the acute and more long-term colibactin-related cytopathic effects of infection with Nissle 1917.
–
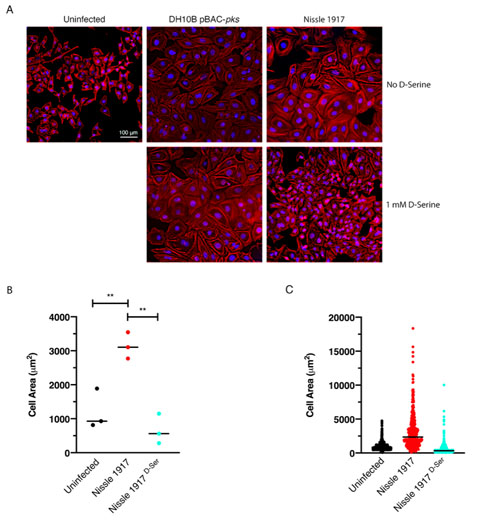 | FIGURE 5: Exposure to D-Serine reduces the colibactin associated cellular senescence. HeLa cells were infected for 4 h with E. coli Nissle 1917 or DH10B hosting BAC-pks (MOI = 400). Infections were performed with and without the addition of 1 mM D-Serine to the growth media. At 8 h after infection, cells were washed and incubated for 72 h to allow for the megacell phenotype to develop. (A) HeLa cell morphology was observed by wide field fluorescence. Actin cytoskeleton was stained with Phalloidin in red and DNA was counterstained with DAPI in blue at 72 h post infection. Scale bar = 100 μm. (B) CellProfiler software was employed to measure the area of the HeLa cells shown in A using images acquired at 10X magnification. 100 cells were measured per sample. Columns represent the mean cell area measured with individual experimental observations indicated by data points for each infection condition. Measurements were acquired from images taken from three independent experiments and statistical significance was assessed by unpaired Student's t-test with, ** indicating P < 0.01. (C) Individual cell area measurements were recorded across triplicate experiments. Black lines indicate the mean. |
–
The D-Serine metabolism locus is not essential for repression of colibactin in pks+ E. coli in response to D-Serine
DsdC is a well-studied D-Serine responsive transcriptional regulator that is required for catabolism of D-Serine via activation of dsdXA [16]. Our recent work has shown that DsdC does not only regulate the dsdCXA operon and is in fact capable of binding of numerous areas of the genome [53]. We hypothesized that the repression of the pks locus by D-Serine might be mediated by DsdC. Therefore, dsdC was deleted in Nissle 1917 and the effect on colibactin production with and without D-Serine was assessed. First, we compared transcriptomes from a previous study [21], which revealed that exposure to D-Serine triggered similar reductions in clb gene expression in both wild type (WT) and ΔdsdC CFT073 strains (Fig. 6A). To assess the effects on genotoxic activity, HeLa cells were infected with Nissle ΔdsdC as described previously. Inclusion of D-Serine resulted in a 6.34-fold reduction in clbB expression compared to cells infected with Nissle ΔdsdC alone (P = 0.0145; Fig. 6B and C). Furthermore, HeLa cells infected with Nissle ΔdsdC in the presence of D-Serine were protected from genotoxicity as lower levels of phosphorylated H2AX were detected, indicating that the DNA repair response was reduced in both WT and ΔdsdC genetic backgrounds. Taken together, these data demonstrate that D-Serine-associated downregulation of pks encoded genes occurs independently of DsdC.
–
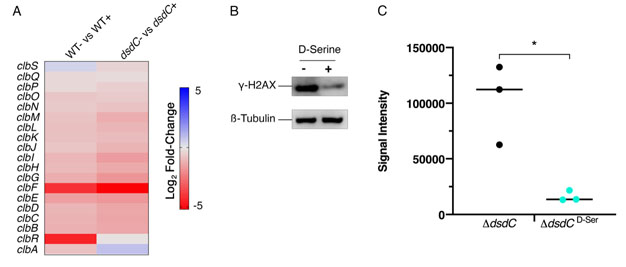 |
FIGURE 6: Deletion of dsdC does not affect D-Serine associated repression of colibactin. Generation of an isogenic mutant, Nissle ΔdsdC, revealed that D-Serine-associated repression of colibactin activity occurred independently of the D-Serine tolerance locus in pks+ E. coli strains. (A) Heat map showing the EdgeR calculated log2 relative fold changes for each gene in the pks island with corresponding colour key adjacent. False discovery rate-corrected P values can be found in Table S1. (B) The genotoxic activity of Nissle ΔdsdC was assessed by infecting HeLa cells as discussed above. Proteins were extracted and the level of H2AX phosphorylation was determined. Immunoblot analysis of cell lysates extracted 4 h post-infection is shown. Anti-γ-H2AX antibody was used as an indicator of double stranded DNA breaks and β-Tubulin was used as a loading control for cell lysates. (C) Signal intensities of bands were measured as described in the methods using LI-COR Image Studio. γ-H2AX signals were corrected to account for any variation in loading using β-Tubulin signal intensity. Experimental signal was normalized so that the mean signal intensity of the samples was equivalent for each experiment. The experiment was carried out in triplicate. Columns represent mean +/- SEM with individual experimental observations indicated by data points. Statistical significance was assessed by unpaired Student's t-test with, * indicating P < 0.05. |
DISCUSSION
Sensing and responding to environmental cues and signalling molecules is crucial for bacterial survival. Indeed, modulating gene expression enables bacteria to adapt and persist in changing environments; a trait that is essential for certain E. coli pathotypes that can colonize multiple sites of the human host. For instance, UPEC strains can survive in both the gastrointestinal tract and the bladder. Strikingly, previous work has shown that UPEC strains extensively carry the dsdCXA locus [10], enabling these strains to metabolize D-Serine in the nutrient deficient bladder. Furthermore, metabolizing D-Serine has been shown to confer a fitness advantage in strains that infect this site [9]. Indeed, there has been a growing appreciation for the important role of amino acids as carbon sources; however, there has also been an emphasis on investigating the regulatory functions of certain amino acids. Investigations into E. coli biofilm formation revealed the spatiotemporal regulation of L-Alanine metabolism is essential for cell viability and growth of colonies [54] whereas catalysis of the amino acid L-Tryptophan was implicated with the inhibition of biofilm formation [55]. In the mammalian host, sensing metabolites can modulate the expression of essential virulence genes. In response to L-Arginine in the gut, EHEC upregulate locus of enterocyte effacement (LEE)-encoded virulence genes to facilitate site-specific colonization of the host [56]. Exposure to D-Serine has been implicated in the downregulation of virulence genes in this E. coli pathotype, with our previous work demonstrating that D-Serine represses the LEE-encoded type three secretion system [10]. While our work has shown that D-Serine is present in trace concentrations in the gut [10], approximately 1000-fold lower than that of the bladder [9], the production of D-Serine by members of the gut microbiome has been reported [57]. As a result, the E. coli strains residing in the gut may encounter localized micro-niches rich in this metabolite, raising the possibility that it functions as a niche-specific regulator of diverse virulence genes in pathogenic E. coli. In this study we observed that, in general, D-amino acids exerted an enhanced ability to regulate expression of the genes involved in colibactin production over their L-amino acid enantiomers. We demonstrated that treatment with several D-amino acids, most notably D-Cysteine and D-Serine, resulted in downregulation of the pks genomic island in colibactin producing E. coli. Interestingly, analysis of gene expression in CFT073, revealed that L-Cysteine and L-Serine, did not significantly repress clbB. Therefore, while L-amino acids are favoured in nature [3], D-amino acids can have distinct effects in regulating gene expression and the mechanisms underpinning these effects warrant further investigation.
–
Colibactin research has been invigorated after a recent breakthrough study revealed that exposure to colibactin caused a specific mutational signature that linked pks+ harbouring E. coli to CRC tumours [36]. Thus, researchers have endeavoured to identify compounds that will inhibit colibactin and prevent the pro-tumorigenic effects. Cougnoux et al., (2016) described the use of boron-based compounds that functioned as enzyme competitors and inhibited the activity of ClbP, the serine peptidase involved in colibactin maturation [58]. Furthermore, the use of these compounds prevented the genotoxic and tumorigenic activity of colibactin on epithelial cells and in a CRC mouse model [58]. Similarly, mesalamine – an anti-inflammatory drug that is used for treating inflammatory bowel disease (IBD) and is associated with reduced risk of CRC in IBD patients [59] – has been shown to reduce clbB expression and hence to inhibit production of colibactin [60]. The increasing prevalence of drug resistance has led to the development of new and natural antimicrobial agents, some of which have interesting biological activities beyond their intended use as bactericidal agents. For example, cinnamon and its essential oil (cinnamaldehyde) have been studied for their antibacterial properties [61]. Interestingly, recent research showed that treatment with these compounds induced downregulation of the pks-encoded clbB gene in E. coli strains isolated from patients with CRC [62]. In addition, tannin, a compound extracted from medicinal plants, was also shown to repress transcription of colibactin and prevent the associated genotoxic activity of colibactin producing E. coli [63]. In this study we have highlighted the important role of naturally available amino acids, by identifying D-Serine, as a potent repressor of colibactin. We showed that exposure to D-Serine prevented colibactin-associated cytopathic effects in eukaryotic cells and that treatment with 1 mM D-Serine was sufficient to induce prolonged protection, with signs of cellular senescence remaining absent after 72 h. This suggests that D-Serine could have prophylactic potential, providing the host with long-lived protection against colibactin production by commensal E. coli residing in the gastrointestinal tract. Such a treatment would particularly benefit high-risk patients, such as individuals with IBD, where the prevalence of E. coli belonging to the B2 phylogroup is high and the incidence of developing CRC is significantly greater [64][65]. While our results indicate promising potential for D-Serine as a therapeutic, it should be noted that colibactin has been detected in urine (an environment rich in D-Serine [9]) from individuals with pks+ urinary tract infections [66]. In the same study, colibactin-induced DNA damage was observed in a murine model of cystitis. Levels of D-Serine can vary across individuals and be affected by diet, hence further work will be needed to understand the potential of D-Serine to repress colibactin in complex host environments.
–
Bacterial gene regulatory networks tightly govern the expression of genes in response to chemical or environmental stimuli; however, current understanding on the regulation of the colibactin gene locus is limited. Homburg et al., (2007) sought to elucidate the transcriptional organization and regulation of the colibactin genes using Nissle 1917 as a model [39]. Their results showed that the clb locus could be divided in to at least seven transcriptional units, of which four were found to be transcribed polycistronically. The polycistronic expression of clbR/clbA indicated a potential regulatory function exerted by the clbR encoded LuxR-like regulatory protein on clbA. Indeed, the expression of clbA is crucial for colibactin production, as it encodes a phosphopantetheinyl transferase that is responsible for the post-translational activation of the PKS and NRPS proteins of the colibactin biosynthesis pathway [39]. Recently, clbR was identified to encode the key transcriptional activator of the clb genes, and expression of this gene was found to directly correlate with the function and production of colibactin in E. coli pks+ strain M1/5 [67]. Different carbon sources have been found to influence clbRA transcript levels, with clbA and clbR upregulated in the presence of glucose and glycerol compared with pyruvate and acetate, where expression levels remained at an intermediate level [39]. Increased expression of clbA was found to be associated with exposure to nondigestible oligosaccharides commonly found in prebiotics such as lactose and raffinose [68], inulin and galacto-oligosaccharides [69]. Inulin also increased expression of clbB, clbQ and clbR [69]. These data highlight that the diet may play a significant role in controlling the production of colibactin, with certain foods potentially creating a pro-tumorigenic environment. Interestingly, iron homeostasis has also been implicated with the production of colibactin, with clbA downregulated and colibactin-associated megalocytosis reduced upon exposure to FeCl3 [70]. Furthermore, supplementation of iron into media containing colibactin-inducing oligosaccharides resulted in the abrogation of clbA induction [69]. The production of colibactin was shown to be regulated by the ferric uptake regulator (Fur) by Tronnet et al., (2016). The study revealed that Fur positively regulated clbA expression, and that transcription was initiated by direct binding of Fur to the clbA promoter [71]. However, iron-dependent transcription of clbA was found to be independent of clbR [71], suggesting the involvement of a second clbA promoter that may be activated upon specific iron conditions. Iron availability is tightly controlled in the host, and Gram-negative bacteria have evolved several iron uptake systems to overcome this limitation, including the secretion of iron sequestering siderophores [72]. Intriguingly, clbA has been shown to have diverse functionality, contributing to the synthesis of both colibactin and the yersiniabactin siderophore [73]. Taken together, these reports suggest that complex regulatory networks are involved in the production of colibactin and that transcription of clb genes may be activated under specific nutritional conditions which could serve as a fitness advantage to pks-harbouring bacteria.
–
D-Serine exposure has been demonstrated to induce the activation of the LTTR DsdC, whose main function has been described to be the activation of dsdXA transcription [16] in response to D-Serine. This cluster facilitates uptake and catabolism of D-Serine, respectively. As DsdC is the primary transcriptional regulator induced in response to D-Serine, we investigated whether the repression of clb genes was mediated by DsdC. Our data indicate that repression of colibactin by D-Serine is not directly facilitated by DsdC, as similar responses to D-Serine were observed in both WT and Nissle ΔdsdC both in terms of repression of clb gene expression and cytopathic responses. These findings were unexpected. Interestingly, Wallenstein et al., (2020) recently demonstrated that the pks-encoded clbR gene is the transcriptional activator of the colibactin genes [67]. Like DsdC, ClbR has been described as a LTTR with a helix-turn-helix DNA-binding motif that interacts with the clbR–clbB intergenic region, suggesting it is involved in the regulation of the pks island [39][67]. LTTR regulators are thought to be activated by a small molecule co-inducer [74]. Therefore, it is also plausible to consider that D-Serine could enter the cell by an alternative transport system and act as a co-inducer of ClbR, Fur, or indeed another elusive LTTR. Indeed, D-Serine can enter the cell via CycA [19][75] thereby potentially explaining why exposure to D-Serine reduced clbB expression in both Nissle ΔdsdC and in the WT. The precise regulatory mechanism by which D-Serine causes a reduction in colibactin gene expression remains unsolved and will be a focus of future work in our group.
–
In conclusion, in this study we have identified a D-amino acid that has a strong regulatory effect on the genes encoded in the pks genomic island. Exposure to D-Serine in pks+ E. coli results in downregulation of the clb genes and consequently, reduced DNA cross-linking and a reduction in the phenotypic responses associated with colibactin-induced DNA damage in cultured eukaryotic cells. Furthermore, deletion of dsdC revealed that D-Serine-induced inhibition of colibactin is not mediated by the D-Serine metabolism locus regulator, DsdC. Understanding the physiological implications in vivo will be key in further exploring the prophylactic potential of D-Serine.
MATERIALS AND METHODS
Bacterial strains, plasmids and cultures
The bacterial strains, plasmids and oligonucleotides used in this study are listed in Table S4 and Table S5. Bacteria were routinely grown at 37°C in Luria broth (LB [Miller's recipe]) before diluting 1/100 into the appropriate medium for experiments or growth analysis. Chloramphenicol was used when appropriate at a concentration of 25 µg/ml. All preparations of M9 minimal medium (Sigma Aldrich; cat# M6030) were supplemented with 0.4% (w/v) glucose unless otherwise stated. For HeLa cell infection experiments, bacteria grown overnight were inoculated in prewarmed MEM-HEPES (Sigma Aldrich; cat# M7278) -/+ 1 mM D-Serine and incubated at 37°C, 200 RPM for 4.5 h. All growth media, antibiotics and chemicals were purchased from Sigma Aldrich unless stated otherwise.
–
Assessment of DNA crosslinking activity
The assay was performed as previously described [29]. Briefly, linearized plasmid DNA was generated by digestion of pUC19 plasmid with BamHI (New England Biolabs). For bacteria-DNA interactions, bacteria were inoculated 1:20 from overnight cultures into 10 mL M9 Minimal Media alone or supplemented with 1 mM D-Serine and grown for 1.5 h. After reaching an OD600 nm of ∼0.6, 1 × 10⁶ CFU were inoculated in 100 μL M9 Minimal media alone or supplemented with 1 mM D-Serine and incubated statically at 37°C for 5 h. Following cultivation, cells were harvested by centrifugation and the media was removed. Cells were resuspended in sterilised nuclease-free water. Then, a mixture of 450 ng of linearized DNA and 1 mM EDTA was added and samples were incubated for a further 40 min. Bacteria were pelleted by centrifuging samples at 5,000 x g for 5 min, then the DNA present in the supernatants was purified using the PCR Purification kit (Qiagen) according to the manufacturer's instructions. A denaturing 1% agarose gel was prepared in a 100 mM NaCl and 2 mM EDTA solution (pH 8.0), then the gel was soaked overnight in an alkaline running buffer solution (40 mM NaOH and 1 mM EDTA, pH ∼12). For each sample, 100 ng of DNA was loaded on to the denaturing agarose gel and then the gel was run at 1 V/cm for 45 min and then for 2 h at 2 V/cm. The gel was neutralized in a 100 mM Tris pH 7.4 buffer solution containing 150 mM NaCl, that was frequently changed, for a total of 45 min. The gel was stained with GelRed and DNA was revealed with UV exposure using the ChemiDoc Imaging System (BioRad).
–
HeLa cell culture, infection and examination of cellular senescence
For bacterial infections, overnight LB cultures of bacteria were cultured in prewarmed MEM-HEPES -/+ 1 mM D-Serine and cultured for 4.5 h at 37°C with 200 RPM agitation. Bacterial suspensions were diluted to OD600 nm of 0.1, before serially diluting and spot plating on LB plates to confirm appropriate cell density. HeLa cells were routinely cultured in DMEM (ThermoFisher Scientific; cat# 61965026) with 10% (v/v) foetal calf serum (FCS) at 37°C, in a 5% CO2 incubator and were maintained by serial passage. For infection experiments, 4 x 10⁴ cells/well were seeded on 13 mm glass coverslips pre-coated with collagen (Millipore; cat# 08-115) as per the manufacturer's instructions. After 24 h and immediately prior to infection, the HeLa cells were washed with DPBS (ThermoFisher Scientific, cat# 14190086) and medium was replaced with MEM-HEPES -/+ 1 mM D-Serine. Bacteria were added to each coverslip at a multiplicity of infection of 400 (200 μl of 0.1 OD600 nm suspension) and infected for 4 h. The cells were washed twice with DPBS 4 h after inoculation, then cells were replenished with DMEM containing 10% (v/v) FCS and 50 μg/ml gentamicin (Sigma Aldrich, cat# G1397) and incubated for 72 h at 37°C, 5% CO2. Next, the cells were fixed in 4% (w/v) paraformaldehyde at room temperature for 15 min. The cells were then permeabilized with 0.1% (v/v) Triton X-100 in DPBS for 5 min. After two washes, each coverslip was stained with 0.2 U Phalloidin-Alexa Fluor 555 (Invitrogen, cat# A34055) for 1 h at room temperature. The cells were washed twice with DPBS before the coverslips were mounted on to a glass slide with 4 μl Vectashield with DAPI (Vector Laboratories, cat# H-1200) and sealed with clear nail polish. Images were acquired using a Zeiss AxioImager M1 and images were processed by deconvolution using Zen 2.3 Pro software (Zeiss). The area of each cell was measured using a pipeline developed on CellProfiler [76]. Briefly, sample images were acquired at 10X magnification to allow for >100 cells to be captured per image. Image files were uploaded to the CellProfiler workspace and analysis was performed for images taken from three replicate experiments.
–
Immunofluorescence analysis of H2AX phosphorylation
HeLa cells were seeded on 13 mm coverslips and infected as described above. Following 4 hours infection cells were washed twice with DPBS and fixed in 4% (w/v) paraformaldehyde for 15 min at room temperature. The cells were permeabilized with 0.1% Triton X-100 and then blocked with 1X Phosphate-Buffered Saline, 0.1% Tween® 20 (PBST) + 10% normal goat serum (Sigma Aldrich, cat# NS02L) for 1 h at room temperature. Next cells were incubated with rabbit monoclonal anti γ-H2AX antibodies (Cell Signalling, cat# 5438S) diluted 1:100 in blocking solution and incubated for 1 h at room temperature. The tissues were washed three times with DPBS, then a fluorescent secondary antibody, Alexa Fluor 555 Goat anti-rabbit IgG (Invitrogen, cat# A32732) diluted 1:400 in blocking solution was applied and incubated for 1 h in the dark at room temperature. Following incubation, tissues were washed three times with DPBS, then coverslips were mounted to a glass slide with 4 μl Vectashield with DAPI and sealed with clear nail polish. Nuclear foci were visualized using a Zeiss LSM 880 confocal microscope (Zeiss).
–
Flow cytometry analysis of H2AX phosphorylation
Twenty-four well tissue culture plates were collagen-coated, seeded with 106 cells/well and infected as described above. The cells were collected by trypsinization 4 h post-infection and washed in DPBS. The cells were then collected by centrifugation and resuspended in a live/dead stain (eFluor 780 [eBioscience, cat# 65-0865-14]) and incubated for 20 min on ice. The cells were washed in excess Stain Buffer (BD Biosciences, cat# 55456) and FC receptor block (DPBS + 10% FCS) was applied before incubating for a further 20 min on ice. Next, the cells were fixed with Cytofix (BD Biosciences, cat# 554655) for 15 min at 37°C and permeabilized with Perm Buffer (BD Biosciences, cat# 558050) for 30 min on ice, before purified mouse anti γ-H2AX (BD Biosciences, cat# 560443) diluted 1:200 in BD Stain Buffer was applied and cells were incubated for 1 h at room temperature. A multichromatic-conjugated secondary antibody, goat anti-mouse IgG (BD Biosciences, cat# 550589) diluted 1:1000 in Stain Buffer was applied and cells were incubated for 1 h at room temperature, keeping samples protected from the light. Cells were eventually suspended in BD Stain Buffer and filtered with a 70 μm filter. Cells were analysed using the BD FACSAria (BD) and the data was analysed using FloJo software. Analysis of the stained cell populations was performed by gating on single, live cells.
–
Western Blot analysis of H2AX phosphorylation
HeLa cells were infected with E. coli Nissle 1917 (MOI = 400) for 4 h then treated with gentamicin for a further 4 h. The tissues were washed and lysed directly in the cell culture well by applying 100 μl of 1X SDS sample buffer and incubating for 5 min then wells were scraped to release attached cells, cell lysates were immediately stored on ice. The cell lysates were heated for 10 min at 90°C, and aliquots were stored at −20°C. Proteins were separated on 4-12% Bis Tris Gel by SDS-PAGE (Invitrogen, cat# NP0321) and transferred to a nitrocellulose membrane (FisherScientific, cat# 88018). Blocking was performed using 5% skimmed milk powder for 1 h in PBST. The membrane was then incubated with anti-γ H2AX primary antibody (Cell Signalling Technologies, cat# 5438S) diluted 1:100 in 5% BSA-PBST and incubated overnight at 4°C. The membrane was then washed three times with PBST for 10 min before being incubated for 1 h with anti-rabbit horseradish peroxidase (HRP)-conjugated secondary antibody (Invitrogen, cat# 656120) diluted 1:2500 in PBST. The membrane was again washed three times with PBST for 10 min. Bound secondary HRP-labelled antibodies were revealed with SuperSignal™ West Femto maximum sensitivity substrate (ThermoFisher Scientific, cat# 34096) and analysed with the C-DiGit® blot scanner (LI-COR). Membranes were stripped with mild stripping buffer and incubated with the primary antibody H2AX (Cell Signalling Technologies, cat# 25955) and detected with the secondary antibody as described above. To control for sample loading, membranes were probed for β-Tubulin (Abcam, cat# ab6046). Proteins were quantified with Image Studio Lite (Licor) and normalized in relation to the β-Tubulin level.
–
RNA Extraction
For screening of amino acids capable of modulating expression of clbB, bacteria were cultured in M9 Minimal Media supplemented with amino acids at 1 mM final concentration for 5 h. The cells were harvested by centrifugation before resuspension in two volumes of RNAprotect Bacteria Reagent (Qiagen, cat# 76506). After a 5 min incubation at room temperature, cells were harvested, and RNA extractions were carried out using PureLink RNA Mini Kit (Thermofisher Scientific, cat# 12183018A) according to manufacturer's instructions. Contaminating DNA was removed by TurboDNase (ThermoFisher Scientific, cat# AM2238) treatment, followed by extraction in phenol-chloroform-isoamyl alcohol (Sigma Aldrich, cat# P2069) and ethanol precipitation at -80°C overnight. RNA was collected by centrifugation before washing with 70% ethanol and resuspending in nuclease-free water.
–
Synthesis of cDNA and RT-qPCR
Ten nanograms of DNA-free total RNA, extracted as described above, was used as a template to prepare 10 μl cDNA using LunaScript®RT SuperMix Kit (New England Biolabs, cat# E3010L) according to manufacturer's instructions. Luna® Universal qPCR Master mix (New England Biolabs, cat# M3003L) was employed for RT-qPCR according to manufacturer's recommendations (Initial denaturation 95°C, 1 min; denaturation 95°C, 15 sec; extension 60°C, 30 sec; 39 cycles). Technical duplicate 20 μl reactions were carried out with 1 μl volumes of cDNA as template and triplicate biological samples of cDNA being analysed. Expression relative to the untreated control was calculated as 2-ΔΔct with [77] gapA amplification being employed as a housekeeping control.
–
Assessment of clbB expression using promoter-gfp fusion reporter
The promoter region upstream of clbB was amplified using the PclbB-Fw and PclbB-Rev primers Table S5, before digesting with BamHI/KpnI and cloning in frame upstream of green fluorescent protein (gfp) in pAJR70 [78]. Bacteria were cultured in MEM-HEPES for 4 h whilst recording OD600 nm, and fluorescence using a BMG Fluostar plate reader. Relative fluorescence was determined by subtracting the fluorescence intensity of an empty vector control from each sample and dividing the corrected fluorescence intensity by OD600 nm. Data presented are from three replicate experiments.
–
Determination of growth rates
To determine the specific growth rate (SGR) of strains, bacteria were cultured in MEM-HEPES or M9 minimal media for up to 8 h whilst recording OD600 nm. Exponential growth was observed between two and five hours for all the strains and media tested. SGR (μ = ΔlnOD 600 nm/Δt) was calculated – ΔlnOD600 nm is the change in natural logarithm of OD600 nm and Δt is the change in time (hours) between two and five hours. OD600 nm was recorded in an Eppendorf D30 Biophotometer. At least three replicate growth curves were constructed for determination of SGR of any given strain.
–
Construction of isogenic ΔdsdC Nissle 1917 mutant strain
A Nissle 1917 mutant lacking dsdC was constructed using standard procedures [79]. Briefly, Nissle 1917 WT was transformed with pKD46. A single colony was cultured at 37°C in LB supplemented with 100 µg/ml ampicillin and 100 mM L-Arabinose to an OD600 nm of 0.4. The cells were then washed and resuspended three times with ice-cold distilled water. A linear deletion fragment was prepared by amplifying the chloramphenicol resistance cassette from pKD3 with oligonucleotides bearing 50 bp 5'-end flanking regions homolgous to the 50 bp regions immediately upstream and downstream of dsdC, Table S5. One microgram of PCR product (phenol-chloroform extracted, before ethanol precipitation and resuspension in 10 μl nuclease-free water) was electroporated at 2500 V into an aliquot of competent Nissle 1917 cells using an Eppendorf Eporator. Insertional mutants grown under chloramphenicol selection were verified by PCR using check primers, Table S5. Resistance cassettes were removed by expression of FLP-recombinase under transient temperature shift to 42°C after transformation of insertional mutants with pCP20. Excision of the resistance cassette was confirmed by PCR.
–
Statistical analysis
Statistical significance was assessed by unpaired two-tailed Student's t-test or ordinary one-way ANOVA, as indicated. Tests were carried out using GraphPad Prism 8.
REFERENCES
- Bäumler AJ, and Sperandio V (2016). Interactions between the microbiota and pathogenic bacteria in the gut. Nature 535(7610): 85–93. 10.1038/nature18849
-
O'Boyle N, Connolly JPR, Tucker NP, and Roe AJ (2020). Genomic plasticity of pathogenic Escherichia coli mediates
d -serine tolerance via multiple adaptive mechanisms. Proc Natl Acad Sci USA 117(36): 22484–22493. 10.1073/pnas.2004977117 - Marcone GL, Rosini E, Crespi E, and Pollegioni L (2020). D-amino acids in foods. Appl Microbiol Biotechnol 104(2): 555–574. 10.1007/s00253-019-10264-9
- Brückner H, and Westhauser T (2003). Chromatographic determination of L- and D-amino acids in plants. Amino Acids 24(1–2): 43–55. 10.1007/s00726-002-0322-8
- Cava F, Lam H, de Pedro MA, and Waldor MK (2011). Emerging knowledge of regulatory roles of D-amino acids in bacteria. Cell Mol Life Sci 68(5): 817–831. 10.1007/s00018-010-0571-8
- Lam H, Oh D-C, Cava F, Takacs CN, Clardy J, de Pedro MA, and Waldor MK (2009). D-amino acids govern stationary phase cell wall remodeling in bacteria. Science 325(5947): 1552–1555. 10.1126/science.1178123
- Elgamoudi BA, Taha T, and Korolik V (2020). Inhibition of Campylobacter jejuni Biofilm Formation by D-Amino Acids. Antibiotics 9(11): 836. 10.3390/antibiotics9110836
- Brauer AL, White AN, Learman BS, Johnson AO, and Armbruster CE (2019). d-Serine Degradation by Proteus mirabilis Contributes to Fitness during Single-Species and Polymicrobial Catheter-Associated Urinary Tract Infection. mSphere 4(1): e00020-19. 10.1128/mSphere.00020-19
- Anfora AT, Haugen BJ, Roesch P, Redford P, and Welch RA (2007). Roles of serine accumulation and catabolism in the colonization of the murine urinary tract by Escherichia coli CFT073. Infect Immun 75(11): 5298–5304. 10.1128/IAI.00652-07
- Connolly JPR, Goldstone RJ, Burgess K, Cogdell RJ, Beatson SA, Vollmer W, Smith DGE, and Roe AJ (2015). The host metabolite D-serine contributes to bacterial niche specificity through gene selection. ISME J 9(4): 1039–1051. 10.1038/ismej.2014.242
- METZLER DE, and SNELL EE (1952). Deamination of serine. II. D-Serine dehydrase, a vitamin B6 enzyme from Escherichia coli. J Biol Chem 198(1): 363–373. 10.1016/s0021-9258(18)55590-3
- Tanigawa M, Shinohara T, Saito M, Nishimura K, Hasegawa Y, Wakabayashi S, Ishizuka M, and Nagata Y (2010). D-Amino acid dehydrogenase from Helicobacter pylori NCTC 11637. Amino Acids 38(1): 247–255. 10.1007/s00726-009-0240-0
- Chang YF, and Adams E (1974). D-lysine catabolic pathway in Pseudomonas putida: interrelations with L-lysine catabolism. J Bacteriol 117(2): 753–764. 10.1128/jb.117.2.753-764.1974
- Pioli D, Venables WA, and Franklin FC (1976). D-Alanine dehydrogenase. Its role in the utilisation of alanine isomers as growth substrates by Pseudomonas aeruginosa PA01. Arch Microbiol 110(23): 287–293. 10.1007/BF00690240
- Kubota T, Kobayashi T, Nunoura T, Maruyama F, and Deguchi S (2016). Enantioselective Utilization of D-Amino Acids by Deep-Sea Microorganisms. Front Microbiol 7: 511. 10.3389/fmicb.2016.00511
- Nørregaard-Madsen M, McFall E, and Valentin-Hansen P (1995). Organization and transcriptional regulation of the Escherichia coli K-12 D-serine tolerance locus. J Bacteriol 177(22): 6456–6461. 10.1128/jb.177.22.6456-6461.1995
- Chen SL, Wu M, Henderson JP, Hooton TM, Hibbing ME, Hultgren SJ, and Gordon JI (2013). Genomic diversity and fitness of E. coli strains recovered from the intestinal and urinary tracts of women with recurrent urinary tract infection. Sci Transl Med 5(184): 184ra60. 10.1126/scitranslmed.3005497
- Roesch PL, Redford P, Batchelet S, Moritz RL, Pellett S, Haugen BJ, Blattner FR, and Welch RA (2003). Uropathogenic Escherichia coli use d-serine deaminase to modulate infection of the murine urinary tract. Mol Microbiol 49(1): 55–67. 10.1046/j.1365-2958.2003.03543.x
- Cosloy SD (1973). D-serine transport system in Escherichia coli K-12. J Bacteriol 114(2): 679–684. 10.1128/jb.114.2.679-684.1973
- Haugen BJ, Pellett S, Redford P, Hamilton HL, Roesch PL, and Welch RA (2007). In Vivo Gene Expression Analysis Identifies Genes Required for Enhanced Colonization of the Mouse Urinary Tract by Uropathogenic Escherichia coli Strain CFT073 dsdA. Infect Immun 75(1): 278–289. 10.1128/IAI.01319-06
- Connolly JPR, Turner NCA, Hallam JC, Rimbi PT, Flett T, McCormack MJ, Roe AJ, and O'Boyle N (2021). d-Serine induces distinct transcriptomes in diverse Escherichia coli pathotypes. Microbiology 167(10). 10.1099/mic.0.001093
- Nougayrède J-P, Homburg S, Taieb F, Boury M, Brzuszkiewicz E, Gottschalk G, Buchrieser C, Hacker J, Dobrindt U, and Oswald E (2006). Escherichia coli induces DNA double-strand breaks in eukaryotic cells. Science 313(5788): 848–851. 10.1126/science.1127059
- Putze J, Hennequin C, Nougayrède J-P, Zhang W, Homburg S, Karch H, Bringer M-A, Fayolle C, Carniel E, Rabsch W, Oelschlaeger TA, Oswald E, Forestier C, Hacker J, and Dobrindt U (2009). Genetic structure and distribution of the colibactin genomic island among members of the family Enterobacteriaceae. Infect Immun 77(11): 4696–4703. 10.1128/IAI.00522-09
- Lu M-C, Chen Y-T, Chiang M-K, Wang Y-C, Hsiao P-Y, Huang Y-J, Lin C-T, Cheng C-C, Liang C-L, and Lai Y-C (2017). Colibactin Contributes to the Hypervirulence of pks+ K1 CC23 Klebsiella pneumoniae in Mouse Meningitis Infections. Front Cell Infect Microbiol 7: 103. 10.3389/fcimb.2017.00103
- Marcq I, Martin P, Payros D, Cuevas-Ramos G, Boury M, Watrin C, Nougayrède J-P, Olier M, and Oswald E (2014). The genotoxin colibactin exacerbates lymphopenia and decreases survival rate in mice infected with septicemic Escherichia coli. J Infect Dis 210(2): 285–294. 10.1093/infdis/jiu071
- McCarthy AJ, Martin P, Cloup E, Stabler RA, Oswald E, and Taylor PW (2015). The Genotoxin Colibactin Is a Determinant of Virulence in Escherichia coli K1 Experimental Neonatal Systemic Infection. Infect Immun 83(9): 3704–3711. 10.1128/IAI.00716-15
- Johnson JR, Johnston B, Kuskowski MA, Nougayrede J-P, and Oswald E (2008). Molecular epidemiology and phylogenetic distribution of the Escherichia coli pks genomic island. J Clin Microbiol 46(12): 3906–3911. 10.1128/JCM.00949-08
- Auvray F, Perrat A, Arimizu Y, Chagneau CV, Bossuet-Greif N, Massip C, Brugère H, Nougayrède J-P, Hayashi T, Branchu P, Ogura Y, and Oswald E (2021). Insights into the acquisition of the pks island and production of colibactin in the Escherichia coli population. Microb Genom 7(5): 000579. 10.1099/mgen.0.000579
- Bossuet-Greif N, Vignard J, Taieb F, Mirey G, Dubois D, Petit C, Oswald E, and Nougayrède J-P (2018). The Colibactin Genotoxin Generates DNA Interstrand Cross-Links in Infected Cells. mBio 9(2): e02393-17. 10.1128/mBio.02393-17
- Cuevas-Ramos G, Petit CR, Marcq I, Boury M, Oswald E, and Nougayrède J-P (2010). Escherichia coli induces DNA damage in vivo and triggers genomic instability in mammalian cells. Proc Natl Acad Sci U S A 107(25): 11537–11542. 10.1073/pnas.1001261107
- Vizcaino MI, Engel P, Trautman E, and Crawford JM (2014). Comparative Metabolomics and Structural Characterizations Illuminate Colibactin Pathway-Dependent Small Molecules. J Am Chem Soc 136(26): 9244–9247. 10.1021/ja503450q
- Xue M, Kim CS, Healy AR, Wernke KM, Wang Z, Frischling MC, Shine EE, Wang W, Herzon SB, and Crawford JM (2019). Structure elucidation of colibactin and its DNA cross-links. Science 365(6457): eaax2685. 10.1126/science.aax2685
- Arthur JC, Perez-Chanona E, Mühlbauer M, Tomkovich S, Uronis JM, Fan T-J, Campbell BJ, Abujamel T, Dogan B, Rogers AB, Rhodes JM, Stintzi A, Simpson KW, Hansen JJ, Keku TO, Fodor AA, and Jobin C (2012). Intestinal inflammation targets cancer-inducing activity of the microbiota. Science 338(6103): 120–123. 10.1126/science.1224820
- Buc E, Dubois D, Sauvanet P, Raisch J, Delmas J, Darfeuille-Michaud A, Pezet D, and Bonnet R (2013). High Prevalence of Mucosa-Associated E. coli Producing Cyclomodulin and Genotoxin in Colon Cancer. PLOS ONE 8(2): e56964. 10.1371/journal.pone.0056964
- Raisch J, Buc E, Bonnet M, Sauvanet P, Vazeille E, de Vallée A, Déchelotte P, Darcha C, Pezet D, Bonnet R, Bringer M-A, and Darfeuille-Michaud A (2014). Colon cancer-associated B2 Escherichia coli colonize gut mucosa and promote cell proliferation. World J Gastroenterol 20(21): 6560–6572. 10.3748/wjg.v20.i21.6560
- Pleguezuelos-Manzano C, Puschhof J, Rosendahl Huber A, van Hoeck A, Wood HM, Nomburg J, Gurjao C, Manders F, Dalmasso G, Stege PB, Paganelli FL, Geurts MH, Beumer J, Mizutani T, Miao Y, van der Linden R, van der Elst S, Genomics England Research Consortium, Garcia KC, Top J, Willems RJL, Giannakis M, Bonnet R, Quirke P, Meyerson M, Cuppen E, van Boxtel R, and Clevers H (2020). Mutational signature in colorectal cancer caused by genotoxic pks+ E. coli. Nature 580(7802): 269–273. 10.1038/s41586-020-2080-8
- Dziubańska-Kusibab PJ, Berger H, Battistini F, Bouwman BAM, Iftekhar A, Katainen R, Cajuso T, Crosetto N, Orozco M, Aaltonen LA, and Meyer TF (2020). Colibactin DNA-damage signature indicates mutational impact in colorectal cancer. Nat Med 26(7): 1063–1069. 10.1038/s41591-020-0908-2
- Siegel R, Ward E, Brawley O, and Jemal A (2011). Cancer statistics, 2011: the impact of eliminating socioeconomic and racial disparities on premature cancer deaths. CA Cancer J Clin 61(4): 212–236. 10.3322/caac.20121
- Homburg S, Oswald E, Hacker J, and Dobrindt U (2007). Expression analysis of the colibactin gene cluster coding for a novel polyketide in Escherichia coli. FEMS Microbiol Lett 275(2): 255–262. 10.1111/j.1574-6968.2007.00889.x
- Zha L, Wilson MR, Brotherton CA, and Balskus EP (2016). Characterization of Polyketide Synthase Machinery from the pks Island Facilitates Isolation of a Candidate Precolibactin. ACS Chem Biol 11(5): 1287–1295. 10.1021/acschembio.6b00014
- Brotherton CA, and Balskus EP (2013). A prodrug resistance mechanism is involved in colibactin biosynthesis and cytotoxicity. J Am Chem Soc 135(9): 3359–3362. 10.1021/ja312154m
- Wassenaar TM (2016). Insights from 100 Years of Research with Probiotic E. Coli. Eur J Microbiol Immunol 6(3): 147–161. 10.1556/1886.2016.00029
- Olier M, Marcq I, Salvador-Cartier C, Secher T, Dobrindt U, Boury M, Bacquié V, Pénary M, Gaultier E, Nougayrède J-P, Fioramonti J, and Oswald E (2012). Genotoxicity of Escherichia coli Nissle 1917 strain cannot be dissociated from its probiotic activity. Gut Microbes 3(6): 501–509. 10.4161/gmic.21737
- Massip C, Branchu P, Bossuet-Greif N, Chagneau CV, Gaillard D, Martin P, Boury M, Sécher T, Dubois D, Nougayrède J-P, and Oswald E (2019). Deciphering the interplay between the genotoxic and probiotic activities of Escherichia coli Nissle 1917. PLOS Pathogens 15(9): e1008029. 10.1371/journal.ppat.1008029
- Nougayrède J-P, Chagneau CV, Motta J-P, Bossuet-Greif N, Belloy M, Taieb F, Gratadoux J-J, Thomas M, Langella P, and Oswald E A Toxic Friend: Genotoxic and Mutagenic Activity of the Probiotic Strain Escherichia coli Nissle 1917. mSphere 6(4): e00624-21. 10.1128/mSphere.00624-21
- Wiles TJ, and Mulvey MA (2013). The RTX pore-forming toxin α-hemolysin of uropathogenic Escherichia coli: progress and perspectives. Future Microbiol 8: 73–84. 10.2217/fmb.12.131
- Goswami C, Fox S, Holden M, Connor M, Leanord A, and Evans TJ (2018). Genetic analysis of invasive Escherichia coli in Scotland reveals determinants of healthcare-associated versus community-acquired infections. Microb Genom 4(6): e000190. 10.1099/mgen.0.000190
- Giunta S, Belotserkovskaya R, and Jackson SP (2010). DNA damage signaling in response to double-strand breaks during mitosis. J Cell Biol 190(2): 197–207. 10.1083/jcb.200911156
- Iacovoni JS, Caron P, Lassadi I, Nicolas E, Massip L, Trouche D, and Legube G (2010). High-resolution profiling of gammaH2AX around DNA double strand breaks in the mammalian genome. EMBO J 29(8): 1446–1457. 10.1038/emboj.2010.38
- Vítor AC, Huertas P, Legube G, and de Almeida SF (2020). Studying DNA Double-Strand Break Repair: An Ever-Growing Toolbox. Front Mol Biosci 7: 24. 10.3389/fmolb.2020.00024
- Rogakou EP, Pilch DR, Orr AH, Ivanova VS, and Bonner WM (1998). DNA double-stranded breaks induce histone H2AX phosphorylation on serine 139. J Biol Chem 273(10): 5858–5868. 10.1074/jbc.273.10.5858
- Hayflick L (1965). THE LIMITED IN VITRO LIFETIME OF HUMAN DIPLOID CELL STRAINS. Exp Cell Res 37: 614–636. 10.1016/0014-4827(65)90211-9
- Connolly JPR, Turner NCA, Serrano E, Rimbi PT, Browning DF, O'Boyle N, and Roe AJ (2022). Control of resistance against bacteriophage killing by a metabolic regulator in meningitis-associated Escherichia coli. Proc Natl Acad Sci U S A 119(45): e2210299119. 10.1073/pnas.2210299119
- Díaz-Pascual F, Lempp M, Nosho K, Jeckel H, Jo JK, Neuhaus K, Hartmann R, Jelli E, Hansen MF, Price-Whelan A, Dietrich LEP, Link H, and Drescher K (2021). Spatial alanine metabolism determines local growth dynamics of Escherichia coli colonies. Elife 10: e70794. 10.7554/eLife.70794
- Shimazaki J, Furukawa S, Ogihara H, and Morinaga Y (2012). L-Tryptophan prevents Escherichia coli biofilm formation and triggers biofilm degradation. Biochem Biophys Res Commun 419(4): 715–718. 10.1016/j.bbrc.2012.02.085
- Menezes-Garcia Z, Kumar A, Zhu W, Winter SE, and Sperandio V (2020). l-Arginine sensing regulates virulence gene expression and disease progression in enteric pathogens. Proc Natl Acad Sci U S A 117(22): 12387–12393. 10.1073/pnas.1919683117
- Matsumoto M, Kunisawa A, Hattori T, Kawana S, Kitada Y, Tamada H, Kawano S, Hayakawa Y, Iida J, and Fukusaki E (2018). Free D-amino acids produced by commensal bacteria in the colonic lumen. Sci Rep 8: 17915. 10.1038/s41598-018-36244-z
- Cougnoux A, Delmas J, Gibold L, Faïs T, Romagnoli C, Robin F, Cuevas-Ramos G, Oswald E, Darfeuille-Michaud A, Prati F, Dalmasso G, and Bonnet R (2016). Small-molecule inhibitors prevent the genotoxic and protumoural effects induced by colibactin-producing bacteria. Gut 65(2): 278–285. 10.1136/gutjnl-2014-307241
- Dahl J-U, Gray MJ, Bazopoulou D, Beaufay F, Lempart J, Koenigsknecht MJ, Wang Y, Baker JR, Hasler WL, Young VB, Sun D, and Jakob U (2017). The anti-inflammatory drug mesalamine targets bacterial polyphosphate accumulation. Nat Microbiol 2: 16267. 10.1038/nmicrobiol.2016.267
- Tang-Fichaux M, Chagneau CV, Bossuet-Greif N, Nougayrède J-P, Oswald É, and Branchu P (2020). The Polyphosphate Kinase of Escherichia coli Is Required for Full Production of the Genotoxin Colibactin. mSphere 5(6): e01195-20. 10.1128/mSphere.01195-20
- Singh G, Maurya S, DeLampasona MP, and Catalan CAN (2007). A comparison of chemical, antioxidant and antimicrobial studies of cinnamon leaf and bark volatile oils, oleoresins and their constituents. Food Chem Toxicol 45(9): 1650–1661. 10.1016/j.fct.2007.02.031
- Kosari F, Taheri M, Moradi A, Hakimi Alni R, and Alikhani MY (2020). Evaluation of cinnamon extract effects on clbB gene expression and biofilm formation in Escherichia coli strains isolated from colon cancer patients. BMC Cancer 20(1): 267. 10.1186/s12885-020-06736-1
- Kaewkod T, Tobe R, Tragoolpua Y, and Mihara H (2021). Medicinal plant extracts protect epithelial cells from infection and DNA damage caused by colibactin-producing Escherichia coli, and inhibit the growth of bacteria. J Appl Microbiol 130(3): 769–785. 10.1111/jam.14817
- Bernstein CN, Blanchard JF, Kliewer E, and Wajda A (2001). Cancer risk in patients with inflammatory bowel disease: a population-based study. Cancer 91(4): 854–862. 10.1002/1097-0142(20010215)91:4<854::aid-cncr1073>3.0.co;2-z
- Kotlowski R, Bernstein CN, Sepehri S, and Krause DO (2007). High prevalence of Escherichia coli belonging to the B2+D phylogenetic group in inflammatory bowel disease. Gut 56(5): 669–675. 10.1136/gut.2006.099796
- Chagneau CV, Massip C, Bossuet-Greif N, Fremez C, Motta J-P, Shima A, Besson C, Faouder PL, Cénac N, Roth M-P, Coppin H, Fontanié M, Martin P, Nougayrède J-P, and Oswald E (2021). Uropathogenic E. coli induces DNA damage in the bladder. PLOS Pathogens 17(2): e1009310. 10.1371/journal.ppat.1009310
- Wallenstein A, Rehm N, Brinkmann M, Selle M, Bossuet-Greif N, Sauer D, Bunk B, Spröer C, Wami HT, Homburg S, von Bünau R, König S, Nougayrède J-P, Overmann J, Oswald E, Müller R, and Dobrindt U (2020). ClbR Is the Key Transcriptional Activator of Colibactin Gene Expression in Escherichia coli. mSphere 5(4): e00591-20. 10.1128/mSphere.00591-20
- Lim CC, Ferguson LR, and Tannock GW (2005). Dietary fibres as “prebiotics”: implications for colorectal cancer. Mol Nutr Food Res 49(6): 609–619. 10.1002/mnfr.200500015
- Oliero M, Calvé A, Fragoso G, Cuisiniere T, Hajjar R, Dobrindt U, and Santos MM (2021). Oligosaccharides increase the genotoxic effect of colibactin produced by pks+ Escherichia coli strains. BMC Cancer 21(1): 172. 10.1186/s12885-021-07876-8
- Tronnet S, Garcie C, Brachmann AO, Piel J, Oswald E, and Martin P (2017). High iron supply inhibits the synthesis of the genotoxin colibactin by pathogenic Escherichia coli through a non-canonical Fur/RyhB-mediated pathway. Pathog Dis 75(5). 10.1093/femspd/ftx066
- Tronnet S, Garcie C, Rehm N, Dobrindt U, Oswald E, and Martin P (2016). Iron Homeostasis Regulates the Genotoxicity of Escherichia coli That Produces Colibactin. Infect Immun 84(12): 3358–3368. 10.1128/IAI.00659-16
- Martin P, Tronnet S, Garcie C, and Oswald E (2017). Interplay between siderophores and colibactin genotoxin in Escherichia coli. IUBMB Life 69(6): 435–441. 10.1002/iub.1612
- Martin P, Marcq I, Magistro G, Penary M, Garcie C, Payros D, Boury M, Olier M, Nougayrède J-P, Audebert M, Chalut C, Schubert S, and Oswald E (2013). Interplay between Siderophores and Colibactin Genotoxin Biosynthetic Pathways in Escherichia coli. PLOS Pathogens 9(7): e1003437. 10.1371/journal.ppat.1003437
- Maddocks SE, and Oyston PCF (2008). Structure and function of the LysR-type transcriptional regulator (LTTR) family proteins. Microbiology 154(Pt 12): 3609–3623. 10.1099/mic.0.2008/022772-0
- Anfora AT, and Welch RA (2006). DsdX is the second D-serine transporter in uropathogenic Escherichia coli clinical isolate CFT073. J Bacteriol 188(18): 6622–6628. 10.1128/JB.00634-06
- McQuin C, Goodman A, Chernyshev V, Kamentsky L, Cimini BA, Karhohs KW, Doan M, Ding L, Rafelski SM, Thirstrup D, Wiegraebe W, Singh S, Becker T, Caicedo JC, and Carpenter AE (2018). CellProfiler 3.0: Next-generation image processing for biology. PLoS Biol 16(7): e2005970. 10.1371/journal.pbio.2005970
- Livak KJ, and Schmittgen TD (2001). Analysis of relative gene expression data using real-time quantitative PCR and the 2(-Delta Delta C(T)) Method. Methods 25(4): 402–408. 10.1006/meth.2001.1262
- Roe AJ, Yull H, Naylor SW, Woodward MJ, Smith DGE, and Gally DL (2003). Heterogeneous Surface Expression of EspA Translocon Filaments by Escherichia coli O157:H7 Is Controlled at the Posttranscriptional Level. Infect Immun 71(10): 5900–5909. 10.1128/IAI.71.10.5900-5909.2003
- Thomason LC, Sawitzke JA, Li X, Costantino N, and Court DL (2014). Recombineering: genetic engineering in bacteria using homologous recombination. Curr Protoc Mol Biol 106: 1.16.1-1.16.39. 10.1002/0471142727.mb0116s106
- Mobley HL, Green DM, Trifillis AL, Johnson DE, Chippendale GR, Lockatell CV, Jones BD, and Warren JW (1990). Pyelonephritogenic Escherichia coli and killing of cultured human renal proximal tubular epithelial cells: role of hemolysin in some strains. Infect Immun 58(5): 1281–1289. 10.1128/iai.58.5.1281-1289.1990
- Nougayrède J-P, Homburg S, Taieb F, Boury M, Brzuszkiewicz E, Gottschalk G, Buchrieser C, Hacker J, Dobrindt U, and Oswald E (2006). Escherichia coli induces DNA double-strand breaks in eukaryotic cells. Science 313(5788): 848–851. 10.1126/science.1127059
- Monk IR, Shah IM, Xu M, Tan M-W, and Foster TJ (2012). Transforming the Untransformable: Application of Direct Transformation To Manipulate Genetically Staphylococcus aureus and Staphylococcus epidermidis. mBio 3(2): e00277-11. 10.1128/mBio.00277-11
- Datsenko KA, and Wanner BL (2000). One-step inactivation of chromosomal genes in Escherichia coli K-12 using PCR products. Proc Natl Acad Sci U S A 97(12): 6640–6645. 10.1073/pnas.120163297
–
SUPPLEMENTAL INFORMATION
 Download Supplemental Information
ACKNOWLEDGMENTS
We thank Diane Vaughan and Alana Hamilton (Flow Core Facility, University of Glasgow, Unit-ed Kingdom) for their assistance with processing samples for flow cytometry and Dr Leandro Lemgruber Soares and Susan Baillie (Glasgow Imaging Facility, University of Glasgow, United Kingdom) for their assistance with the acquisition of confocal images. We are very grateful to Dr Michael Ormsby (University of Stirling, United King-dom) and Dr James Connolly (Newcastle University, Unit-ed Kingdom) for their insightful appraisal of our manu-script. This work is supported by the Biotechnology and Biological Sciences Research Council, grant numbers BB/M029646/1 and BB/R006539/1. The work per-formed in Toulouse, France, was funded by the French National Agency for Research (ANR), grant number UTI-TOUL ANR-17-CE35-0010 and ANR-19-AMRB-0008.
COPYRIGHT
© 2023

D-Serine reduces the expression of the cytopathic genotoxin colibactin by Hallam et al. is licensed under a Creative Commons Attribution 4.0 International License.