
Back to article: A novel system to monitor mitochondrial translation in yeast
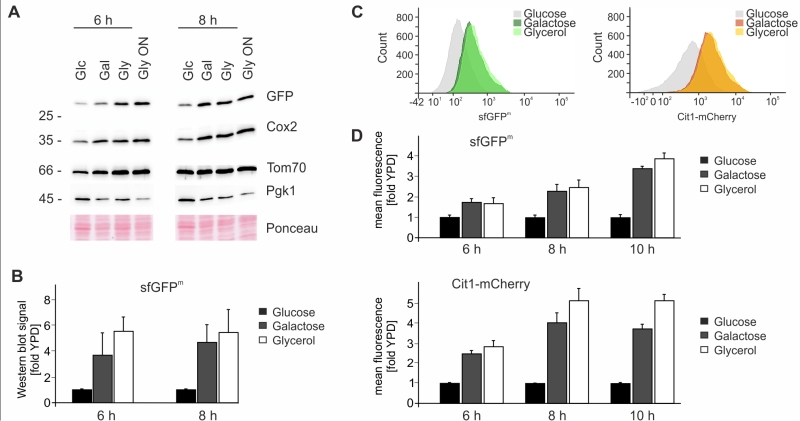
FIGURE 3: Analysis of sfGFPm expression. (A) Cells from an overnight culture in YPD were grown to exponential phase for six or eight hours on different carbon sources. Whole cell extracts were separated on SDS-PAGE and analyzed with Western Blotting using the indicated antibodies. (B) Quantification of Western blotting signal of three independent experiments represented as means +/- SD. GFP signals were normalized to that of 3-phosphoglycerate kinase (Pgk1) and the YPD signal was set to 1. (C) Flow cytometry histogram showing sfGFPm and Cit1-mCherry signals of cells grown on the indicated carbon sources. (D) As in A) but cells were analyzed using flow cytometry. Signal intensities of sfGFPm and Cit1-mCherry were quantified from eight independent samples, and the fluorescence intensity recorded for a strain lacking any fluorescent tag was subtracted as background. Signals on galactose or glycerol were normalized to the respective time point on glucose and the mean +/- SEM is depicted.