
Back to article: A novel system to monitor mitochondrial translation in yeast
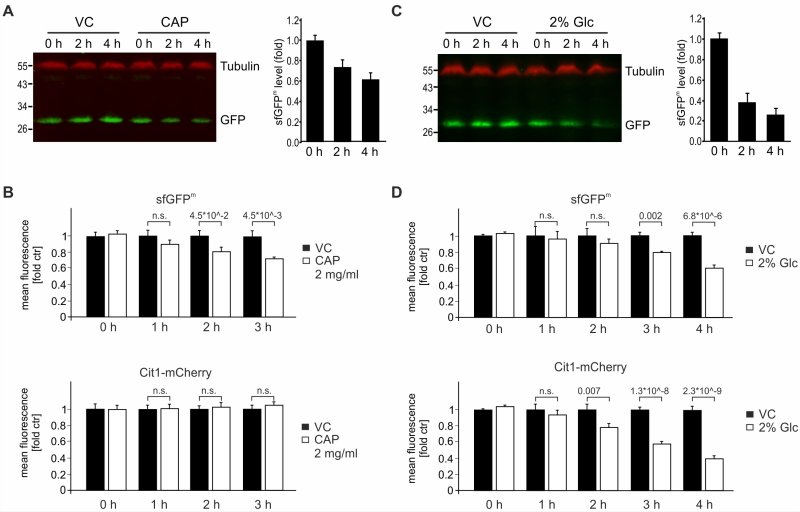
FIGURE 4: Impact on sfGFPm protein levels by inhibition of mitochondrial translation or glucose repression. (A) Cells from an overnight culture in YPD were grown to exponential phase for six hours in glycerol. Cells were treated with 2 mg/ml chloramphenicol (CAP) or vehicle control (VC) for the indicated times and whole cell extracts were separated on SDS-PAGE and analyzed with Western Blotting using the indicated antibodies. The fluorescence signals of 6 independent experiments were quantified and the GFP signals were normalized to the tubulin signals. Data is depicted as fold of the respective untreated time point and the mean +/- SEM is displayed. (B) As in (A) but cells were analyzed using flow cytometry. Signals of sfGFPm and Cit1-mCherry were quantified from eight independent samples, and the fluorescence intensity recorded for a strain lacking any fluorescent tag was subtracted as background before signals from treated cells were normalized to control values. Numbers indicate significance values from student t-test. (C) Cells were grown as in A, but exposed to glucose. (D) As in (B) but cells were exposed to glucose. Numbers indicate significance values from student t-test.