Back to article: Molecular signature of the imprintosome complex at the mating-type locus in fission yeast
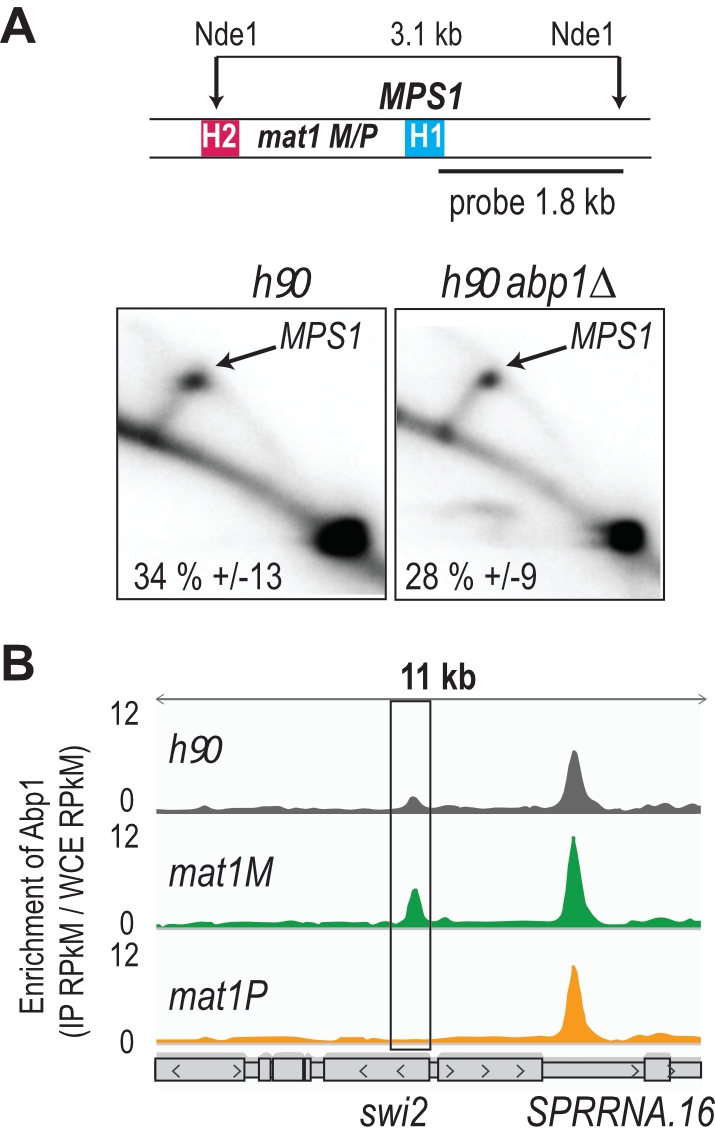
FIGURE 2: Abp1 does not control MPS1 but is recruited at swi2 as a function of the mating type. (A) The upper panel indicates the probe and re-striction enzyme used for the analysis of the replication intermediates. The lower panel represents the 2D gel analysis of the MPS1 site at mat1 in h90 strain and in h90 abp1∆ strain (n=3). (B) Distribution of normalized enrichments of the Abp1 ChIPs at the swi2 locus (IP RPkM / WCE RPkM) in h90 (gray), mat1M stable (green) and mat1P stable (orange). Gray boxes indicate the genes in the region and arrows the transcription direction. Loci where Abp1 is enriched are annotated.

