
Back to article: Molecular signature of the imprintosome complex at the mating-type locus in fission yeast
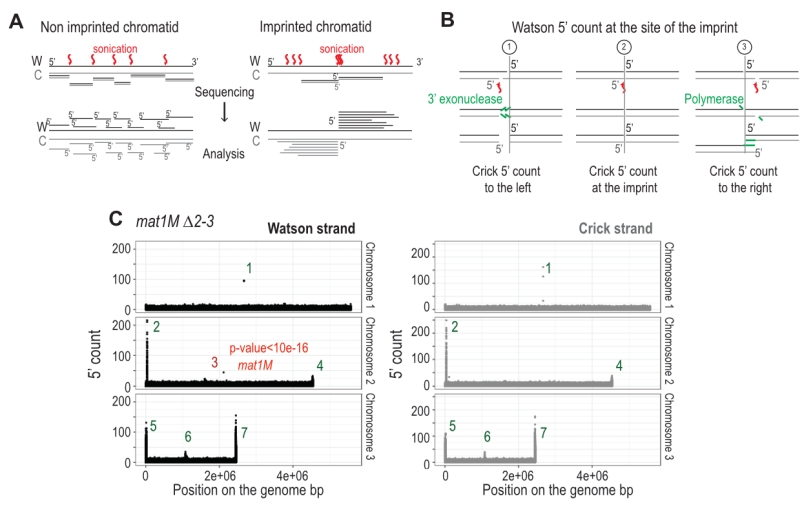
FIGURE 6: The imprint site is detectable by high throughput sequencing on the Watson strand. (A) Schematic view of the result of the sonication of both chromatid types. Red arrows indicate sites of sonication breakage. The black strand is the Watson strand (W) and the gray the Crick (C). 5′ of Watson are shown in black and those of Crick in gray. Lower panel indicates the different types of reads obtained after sequencing. (B) Schematic representation of the blunting of the end that is used during libraries preparation. The Crick and Watson 5′ ends are preserved after treatment. The Crick strand can break at 3 positions compared to the imprint site: to the left, across or to the right. (C) Distribution of the 5′ count per position in the genome on both strands. mat1M ∆2-3 stain was used for the analysis. p-value is calculated using a theoretical t-student distribution that fits on the distribution of the whole-genome observed 5′ count. Regions that have a high 5′ count are numerat-ed.