
Back to article: Molecular signature of the imprintosome complex at the mating-type locus in fission yeast
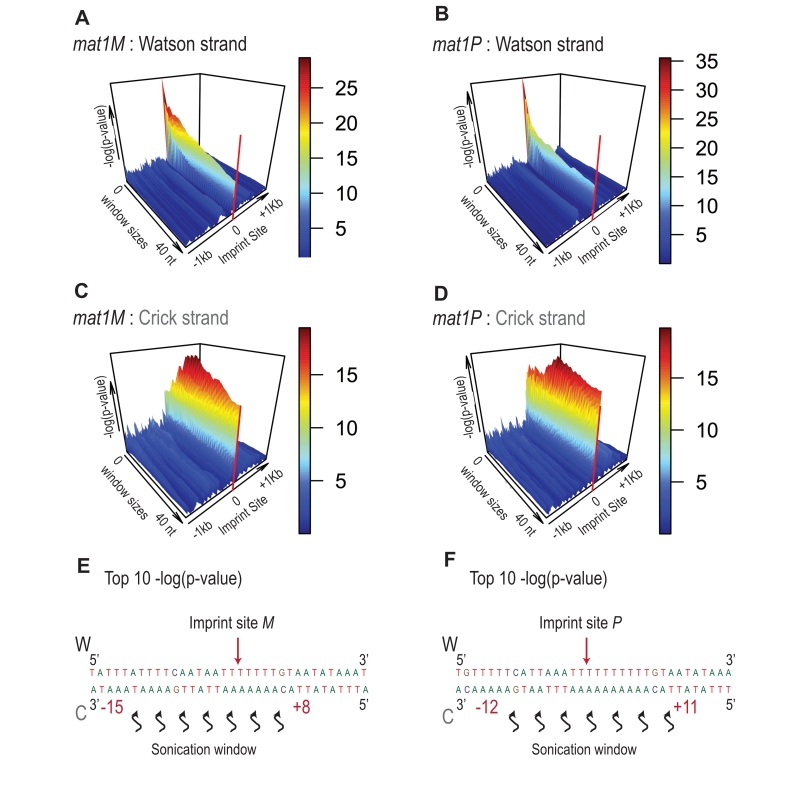
FIGURE 8: Signature of sonication across the imprint. Statistical analysis of the 5′ count in the mat1 region. -log(p-value) of 5′ count as a function of the window size and genome position is represented. The -log(p-value) scale is indicated on the right of the graphics. The p-value is calculated using theoretical t-student distributions that fit with the distribution of 5′ count observe in the 10-kb region that contains mat1. (A) A sliding window (+/- 1 kb around the imprint site) with step size one and varying window size (1 to 40 nt) is applied when calculating the -log(p-value) of the 5′ count of the Watson strand shown. The sequencing of a mat1M ∆2-3 strain is used. (B) Same as in (A) for the Crick strand. (C) Window sizes and window positions compared to imprint site for the top 10 -log(p-value) are indicated. (D, E and F) Same as in (A, B and C), respectively for the sequencing of a mat1P ∆2-3 strain.