
Back to article: Molecular signature of the imprintosome complex at the mating-type locus in fission yeast
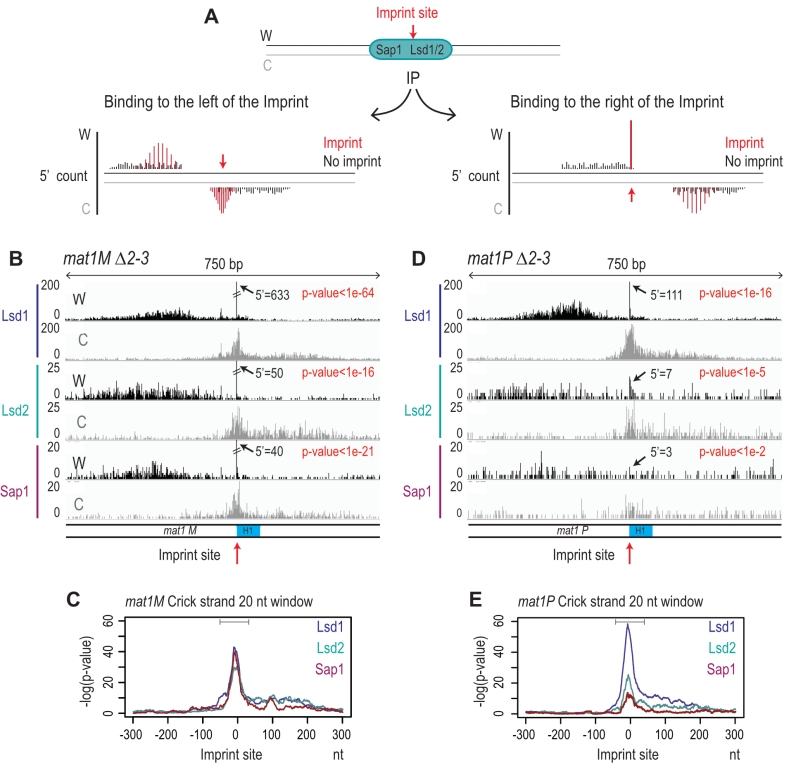
FIGURE 9: Lsd1/2 and Sap1 immunoprecipitate chromatids on both sides of the imprint. Result of the 5′ count analysis of the ChIP data presented in Figure 3C. (A) Schematic representation of the theoretical 5′ count distribution of Lsd1/2 and Sap1. In black, the 5′ count of a non-imprinted chromatid and in red that of an imprinted chromatid. (B) Distribution of the 5′ count of the Lsd1/2 and Sap1 ChIPs for the Watson strand (black) and Crick strand (gray) in the mat1M ∆2-3 background. The 5′ count at the imprint site is indicated. The p-value is calculated using theoretical t-student distributions that fit with the distribution of 5′ count observed in the 10-kb region that contains mat1. (C) Analysis of the 5′ count bias on the crick strand using a 20 nt window in a mat1M ∆2-3 strains for the IPs of Lsd1-2 and Sap1. A sliding window of 20 nt with set size one is used in a 10 kb region around mat1 is applied. Gray line indicates the bias of the crick across the imprint. (D) Same as in (B) in a mat1P ∆2-3 strain. (E) Same as in (C) in a mat1P ∆2-3 strain.