
Back to article: The effect of multiple sclerosis therapy on gut microbiota dysbiosis: a longitudinal prospective study
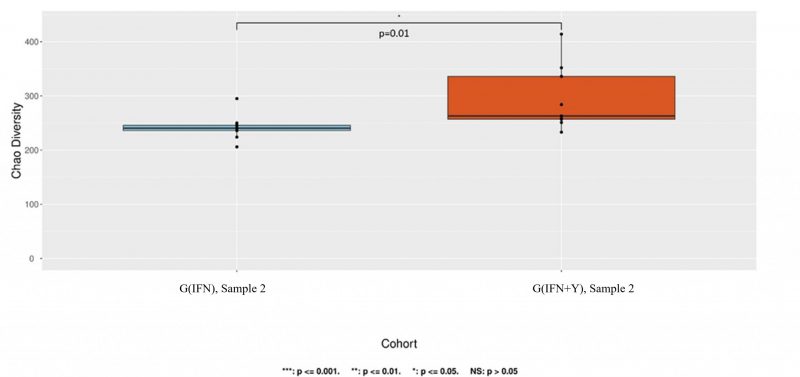
Figure 1: Chao alpha diversity boxplots (species level)-G(IFN) vs G(IFN+Y), sample 2. Boxplot graph representing the differences between alpha diversity in G(IFN) (blue) and G(IFN+Y) (red), using Chao index, for the second sample, at species level. Chao index is associated with species’ richness. There is statistically significant difference between groups, p=0.01. The central dot represents the mean value, lower box limit-25% quartile value, central line-median value, upper box limit-75% quartile value, lower point-minimum value, upper point-maximum value. G(IFN)-group treated with interferon; G(IFN+Y)- participants treated with the combination of interferon and IgY supplement.