
Back to article: The effect of multiple sclerosis therapy on gut microbiota dysbiosis: a longitudinal prospective study
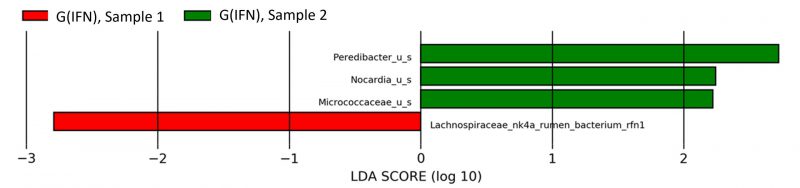
Figure 4: Lefse analysis at species level between sample 1 and sample 2, G(IFN). Lefse represents the differences in species’ relative abundance between the second and the first sample of G(IFN) group. We used an alpha value of 0.05 and a logarithmic score (LDA) of 2. In red color we find the statistically significant enriched bacteria, while in green color there are reduced species in the first group compared to the second one. Lefse- Linear Discriminant Analysis Effect Size; G(IFN)-group treated with interferon.