
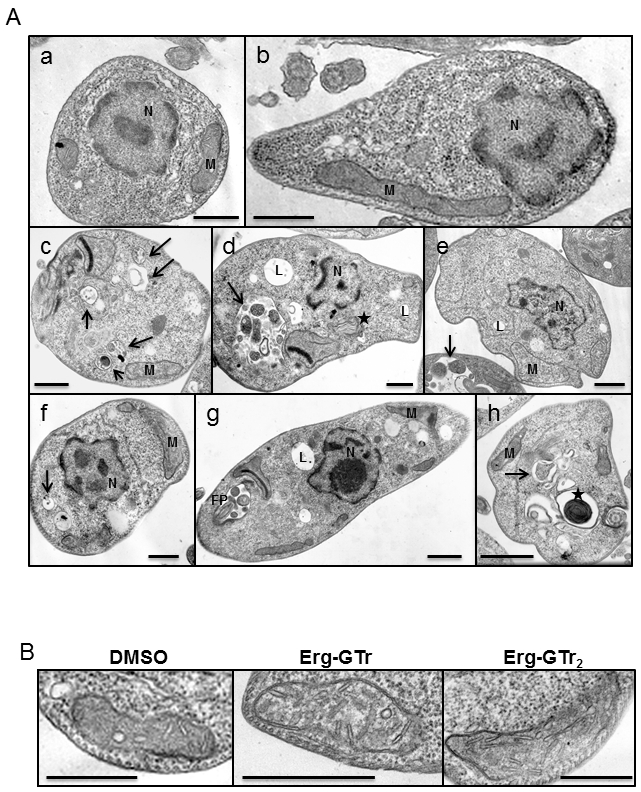
FIGURE 5: Transmission electron microscopy (TEM) of Epon-embedded cells. Parasites were treated with 1.4 μM Erg-GTr, 2.3 μM Erg-GTr2 or DMSO (control cells), harvested after 48 hours and prepared for TEM.
(A) The most obvious alterations in Erg-GTr-treated cells are as follows: increase of vacuolar structures containing cytoplasmic material (c, d, f, h), myelin-like structures (d, h), increase of lysosomes (d, e, g), and flagellar pocket containing some material (g). Note the usual appearance of mitochondria, nucleus and cytoplasmic content in control cells (a, b). Abbreviations used: lysosome (L); nucleus (N); flagellar pocket (FP); mitochondrion (M). Arrows and asterisk indicate autophagosomes and myelin-like structures, respectively.
(B) Mitochondrion zoom in to show cristae. More than 50% of the Erg-GTr treated parasites showed increase in cristae number and size. Bars represent 0.5 μm each.