Back to article: Conventional and emerging roles of the energy sensor Snf1/AMPK in Saccharomyces cerevisiae
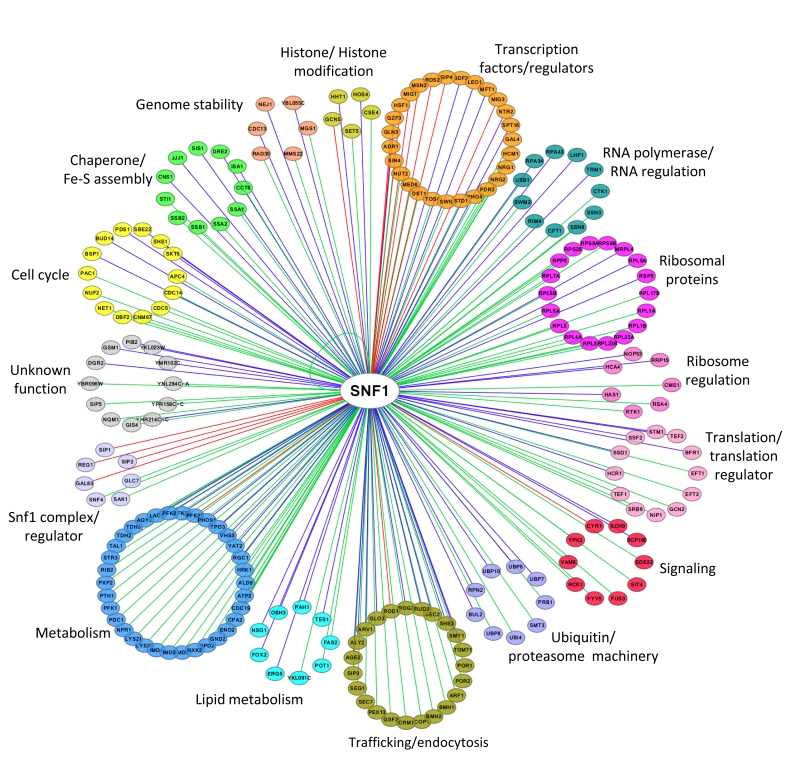
FIGURE 2: Network of Snf1 physical interactors. The network reports the known physical associations obtained from SGD (Saccharomyces Genome Database, http://www.yeastgenome.org). Interactors are clustered according to their function and colored differently. When the interactor is also a substrate of Snf1 according to the Yeast Kinase Interaction Database (KID, http://www.moseslab.csb.utoronto.ca/KID/; [44]), the edge is colored in red if phosphorylation was analyzed by low throughput assays (LTP in vitro kinase assays; in vitro phosphorylation site mapping; in vivo phosphorylation site mapping; phosphorylation reduced or absent in kinase mutant) or in blue if phosphorylation was assayed only by high throughput analysis (protein chip data for in vitro phosphorylated substrate; HTP in vitro phosphorylation). Data visualization and analysis was performed with Cytoscape [45].
65. Sharifpoor S, Nguyen Ba AN, Youn J-Y, Young J-Y, van Dyk D, Friesen H, Douglas AC, Kurat CF, Chong YT, Founk K, Moses AM, and Andrews BJ (2011). A quantitative literature-curated gold standard for kinase-substrate pairs. Genome Biol 12(4): R39. https://doi.org/10.1186/gb-2011-12-4-r39
66. Cline MS et al. (2007). Integration of biological networks and gene expression data using Cytoscape. Nat Protoc 2(10): 2366-82. https://doi.org/10.1038/nprot.2007.324

