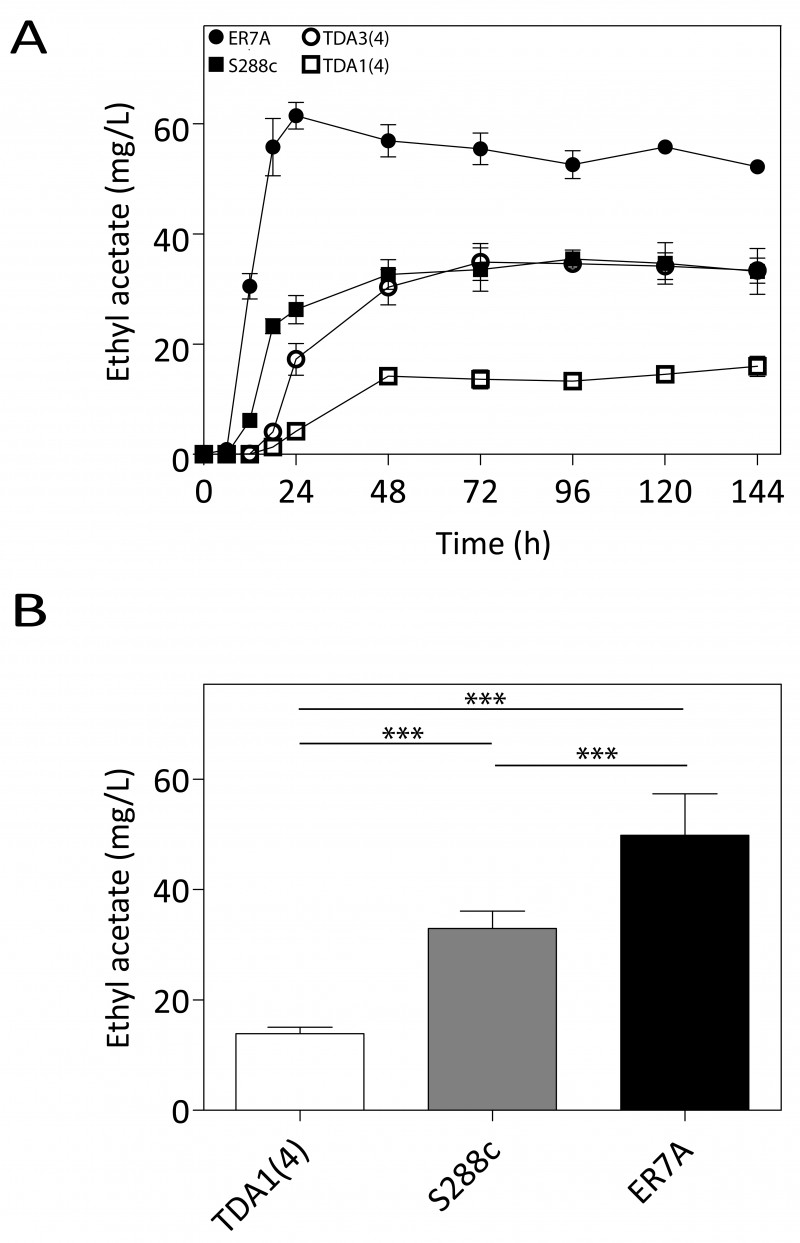
FIGURE 3: Ethyl acetate production in small-scale semi-anaerobic fermentations. (A) Ethyl acetate concentration during the course of a semi-anaerobic fermentation in 100 mL 10% YPD. Strains: (¢) S288c, () ER7A, (☐) TDA1(4) and () TDA3(4). (B) Ethyl acetate concentrations produced after 96 h, were analysed by a one-way ANOVA for TDA1(4) (white bar), S288c (grey bar) and ER7A (black bar) (p-value ≤0.001). Subsequent multiple comparison was carried out by a post hoc Tukey test with p-value ≤0.001 (***).
By continuing to use the site, you agree to the use of cookies. more information
The cookie settings on this website are set to "allow cookies" to give you the best browsing experience possible. If you continue to use this website without changing your cookie settings or you click "Accept" below then you are consenting to this. Please refer to our "privacy statement" and our "terms of use" for further information.

