
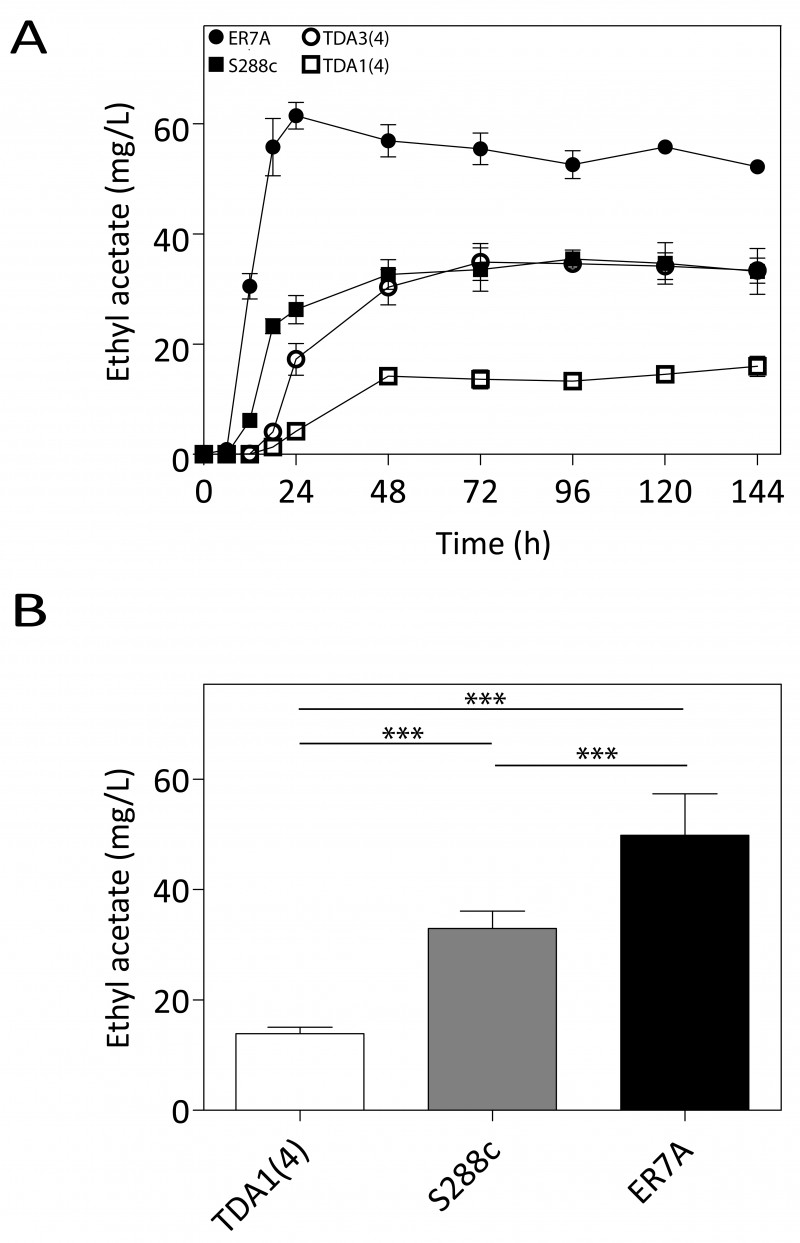
FIGURE 3: Ethyl acetate production in small-scale semi-anaerobic fermentations. (A) Ethyl acetate concentration during the course of a semi-anaerobic fermentation in 100 mL 10% YPD. Strains: (¢) S288c, () ER7A, (☐) TDA1(4) and () TDA3(4). (B) Ethyl acetate concentrations produced after 96 h, were analysed by a one-way ANOVA for TDA1(4) (white bar), S288c (grey bar) and ER7A (black bar) (p-value ≤0.001). Subsequent multiple comparison was carried out by a post hoc Tukey test with p-value ≤0.001 (***).