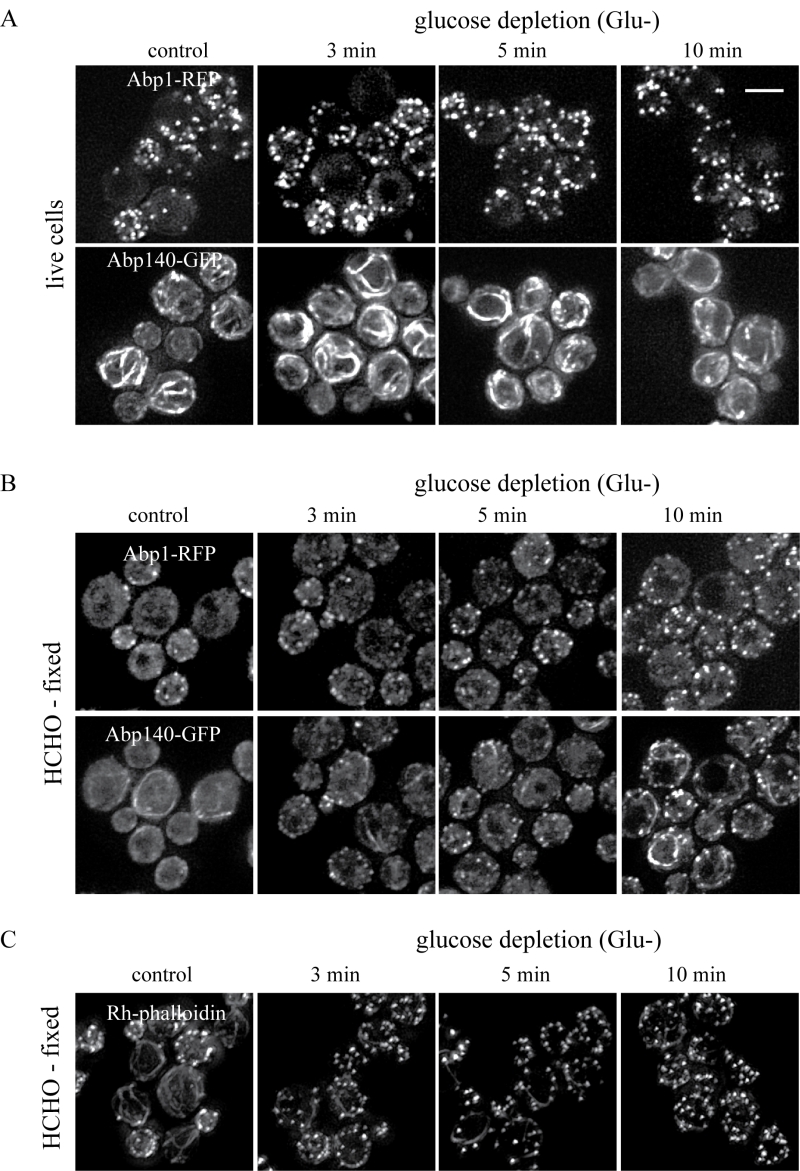
FIGURE 3: The effect of glucose deprivation on F-actin distribution was analyzed at defined time points after the shift of cells into glucose-free medium. Z-stacks of S. cerevisiae (rho+) cells co-expressing Abp1-RFP and Abp140-GFP from chromosomal sites (strain CRY1337) inspected as live cells (A) or after fixation with 3.7 % formaldehyde for 30 minutes (B) (HCHO-fixed). (C) The Z-stack of formaldehyde-fixed S. cerevisiae (rho+) cells (strain CRY339) stained with Rh-phalloidin for F-actin. Bar, 5 µm.
By continuing to use the site, you agree to the use of cookies. more information
The cookie settings on this website are set to "allow cookies" to give you the best browsing experience possible. If you continue to use this website without changing your cookie settings or you click "Accept" below then you are consenting to this. Please refer to our "privacy statement" and our "terms of use" for further information.

