
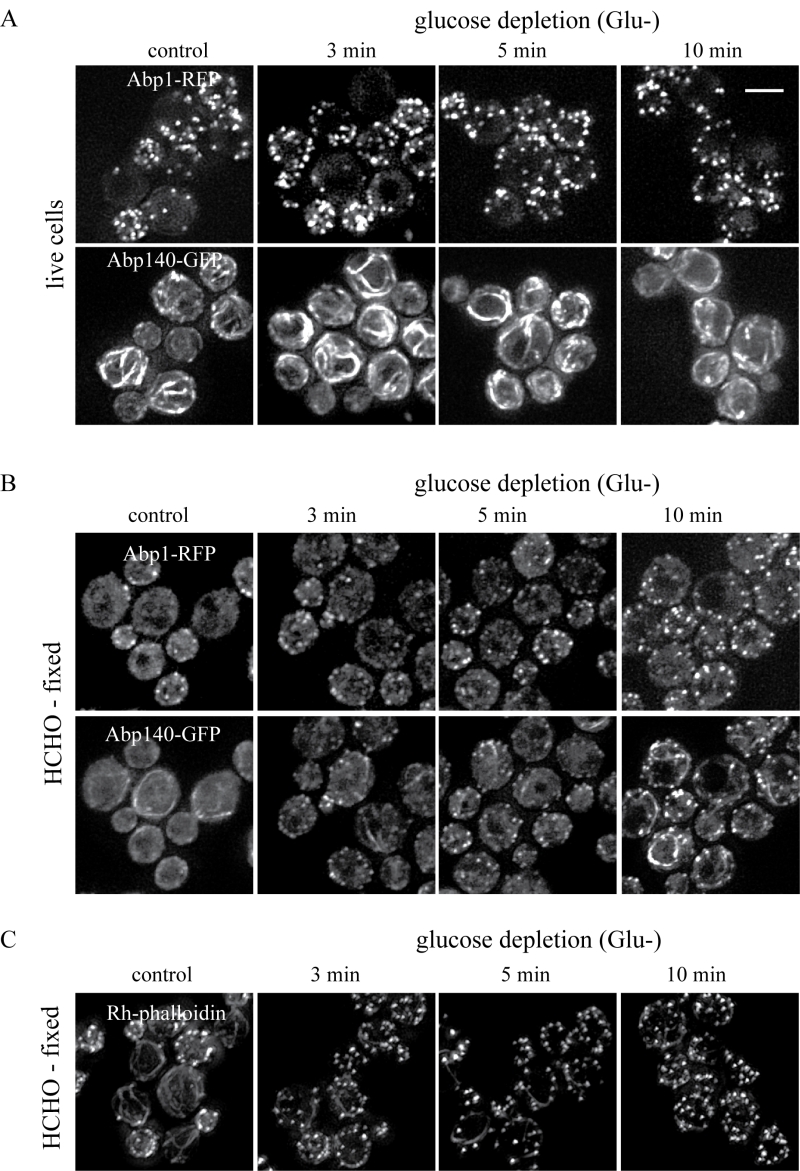
FIGURE 3: The effect of glucose deprivation on F-actin distribution was analyzed at defined time points after the shift of cells into glucose-free medium. Z-stacks of S. cerevisiae (rho+) cells co-expressing Abp1-RFP and Abp140-GFP from chromosomal sites (strain CRY1337) inspected as live cells (A) or after fixation with 3.7 % formaldehyde for 30 minutes (B) (HCHO-fixed). (C) The Z-stack of formaldehyde-fixed S. cerevisiae (rho+) cells (strain CRY339) stained with Rh-phalloidin for F-actin. Bar, 5 µm.