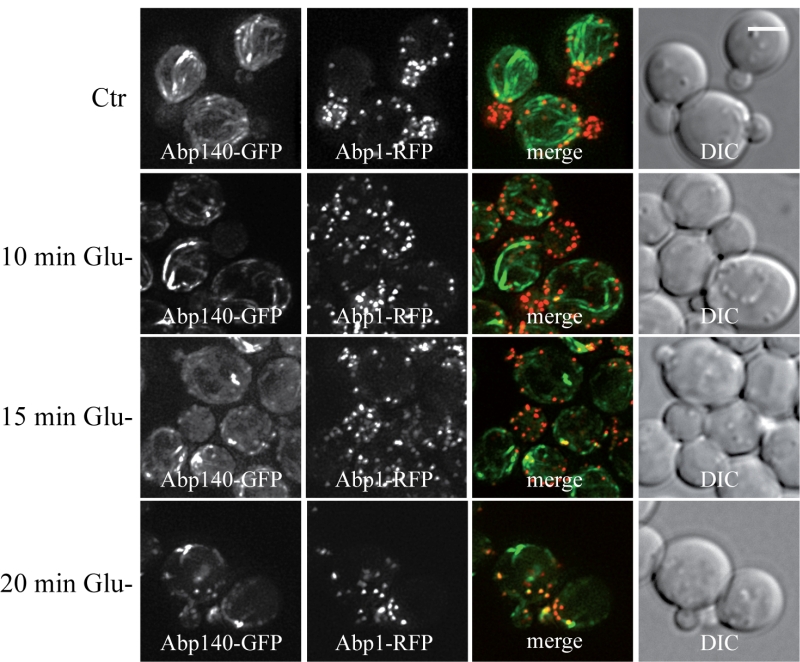
FIGURE 6: Detailed time course analyses of the glucose-depletion effect on S. cerevisiae (rho0) live cells co-expressing Abp1-RFP and Abp140-GFP from chromosomal sites (strain CRY1454). The number of Abp140-GFP filaments decreased with time of glucose depletion. Distribution of fluorescent markers is presented after deconvolution and projection of several images in the stack (Z-stack) using Xcellence software (Olympus). Bar, 5 µm.
By continuing to use the site, you agree to the use of cookies. more information
The cookie settings on this website are set to "allow cookies" to give you the best browsing experience possible. If you continue to use this website without changing your cookie settings or you click "Accept" below then you are consenting to this. Please refer to our "privacy statement" and our "terms of use" for further information.

