
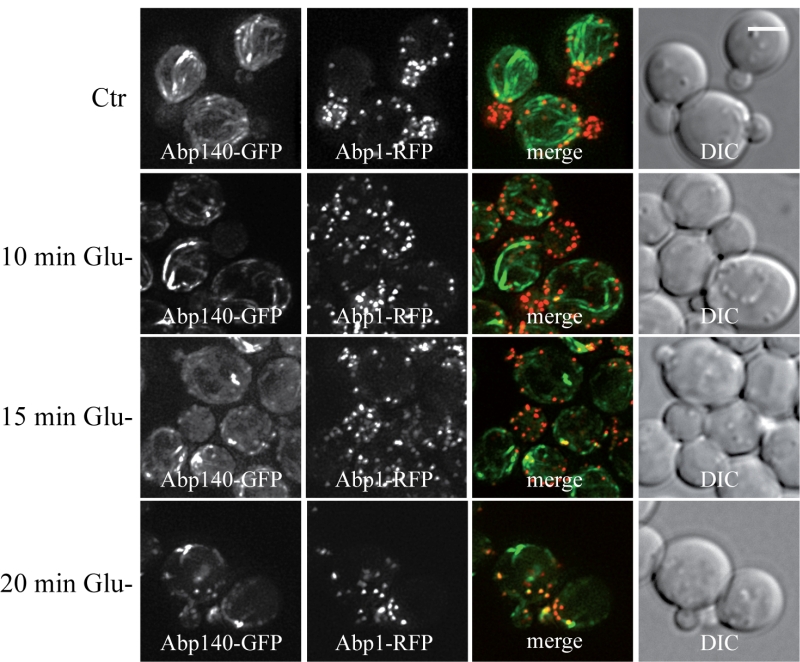
FIGURE 6: Detailed time course analyses of the glucose-depletion effect on S. cerevisiae (rho0) live cells co-expressing Abp1-RFP and Abp140-GFP from chromosomal sites (strain CRY1454). The number of Abp140-GFP filaments decreased with time of glucose depletion. Distribution of fluorescent markers is presented after deconvolution and projection of several images in the stack (Z-stack) using Xcellence software (Olympus). Bar, 5 µm.