
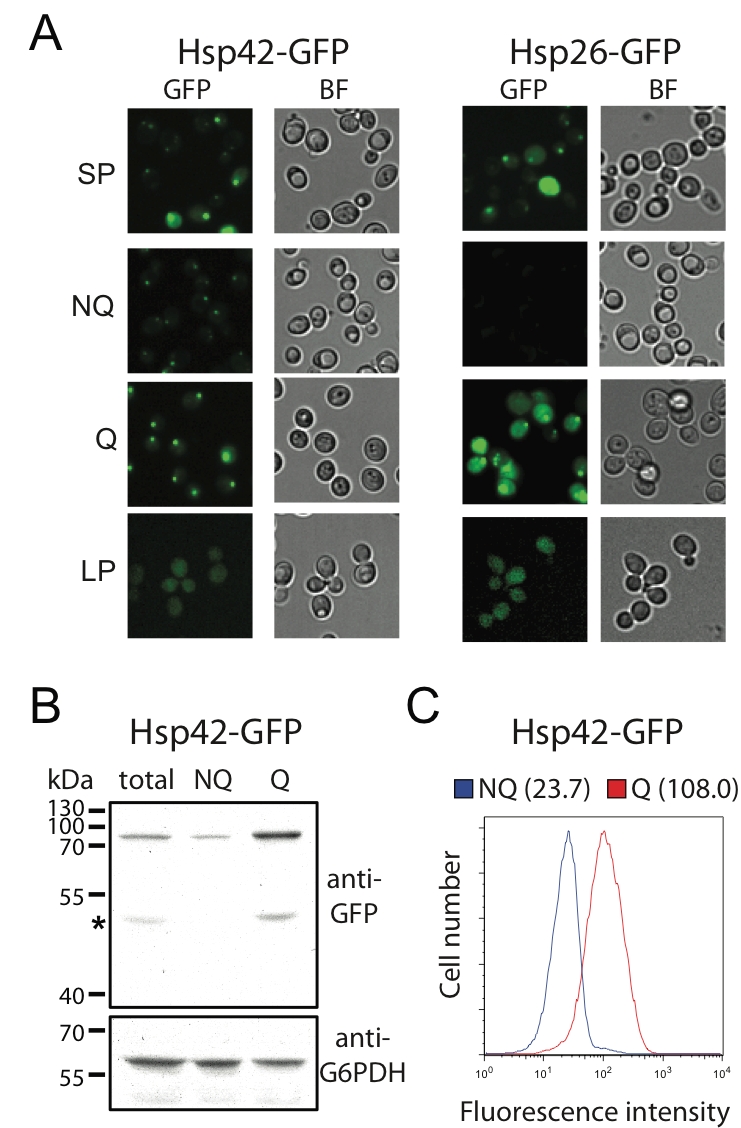
FIGURE 2: The formation of Hsp42-SPGs is enhanced in Q cells. (A) Images of stationary phase, log phase, Q and NQ cells carrying GFP-tagged Hsp42 or Hsp26. The fluorescence intensity of Hsp42-SPGs in Q cells is generally brighter than that in NQ cells. Also see Fig. 1 for the detailed experimental description. (B) Western blot results show that Hsp42-GFP is up-regulated in Q cells. Protein from total stationary phase, Q, and NQ cells was extracted and detected using anti-GFP and anti-G6PDH antibodies. The signal intensity of the Western blot was quantified. The normalized mean values and standard errors of relative ratios of Hsp42-GFP/G6PDH from three biological repeats are 1.0 ± 0.11, 0.5 ± 0.10, and 3.3 ± 0.21 for total stationary phase cultures, NQ cells and Q cells, respectively. The asterisk indicates the degradation form of Hsp42-GFP. (C) Flow cytometry results show that the fluorescence intensity of Hsp42-GFP in Q cells is higher than that in NQ cells. Numbers in the parentheses are the median Hsp42-GFP intensities of Q and NQ cells.