
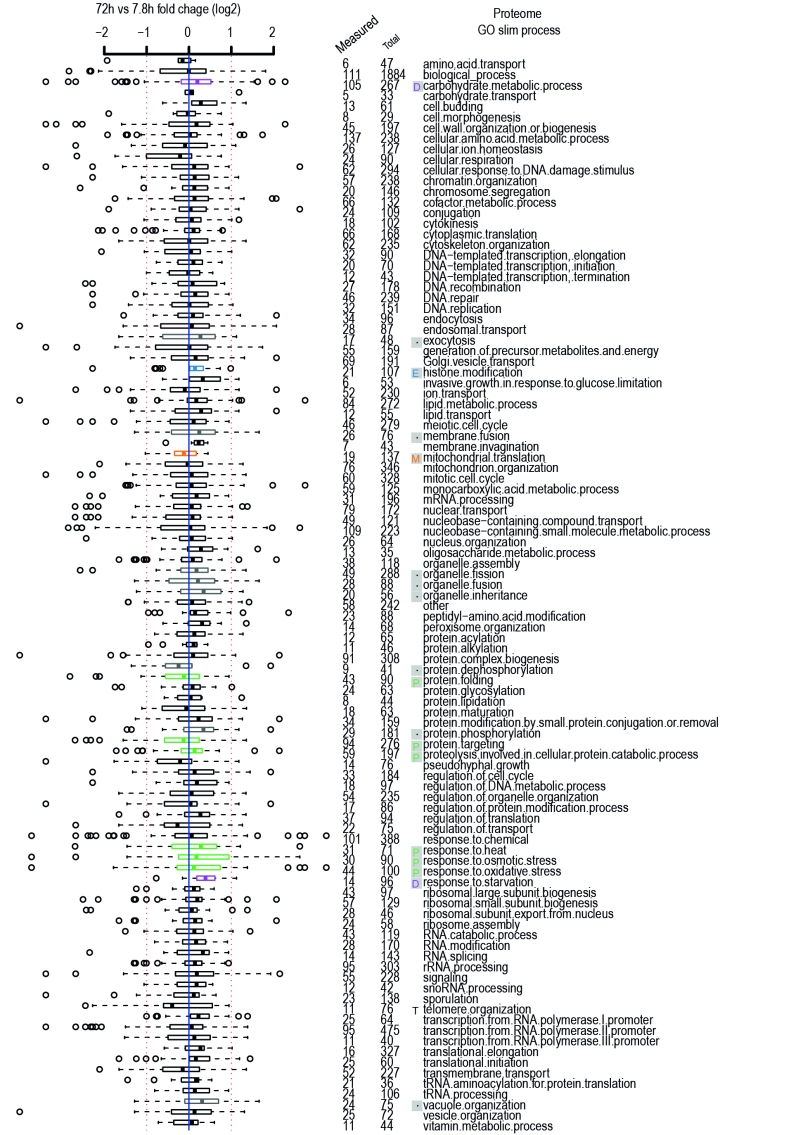
FIGURE 2: Age-related changes in Gene Ontology Processes. Gene ontology process categories taken from GO Slim lists of yeastgenome.org. Relevant Hallmarks of Aging are listed next to terms, as discussed in the text, same legend as Figure 1. Plot is comparison of old (~72 hours of aging with roughly 42% viability of the population) versus young (~8 hours of aging with nearly 100% viability of the population) protein-level changes from the [7] dataset. Data expressed in terms of fold change on a log2 scale. Red dashed line indicates two fold change. Blue solid line zero change. Numbers of proteins measured per GO term are listed out of total proteins in category. Distributions of fold changes per GO term expressed as horizontal box-and-whisker plots. The thick black line within the box is the median of the data, the box extends to the upper and lower quartile of the dataset (i.e. to include 25% of the data above and below the median, respectively), whiskers (dashed lines) represent up to 1.5 times the upper or lower quartiles and circles represent outliers.
7. Janssens GE, Meinema AC, González J, Wolters JC, Schmidt A, Guryev V, Bischoff R, Wit EC, Veenhoff LM, Heinemann M (2015). Protein Biogenesis Machinery is a Driver of Replicative Aging in Yeast. eLife 4:e08527. http://dx.doi.org/10.7554/elife.08527