
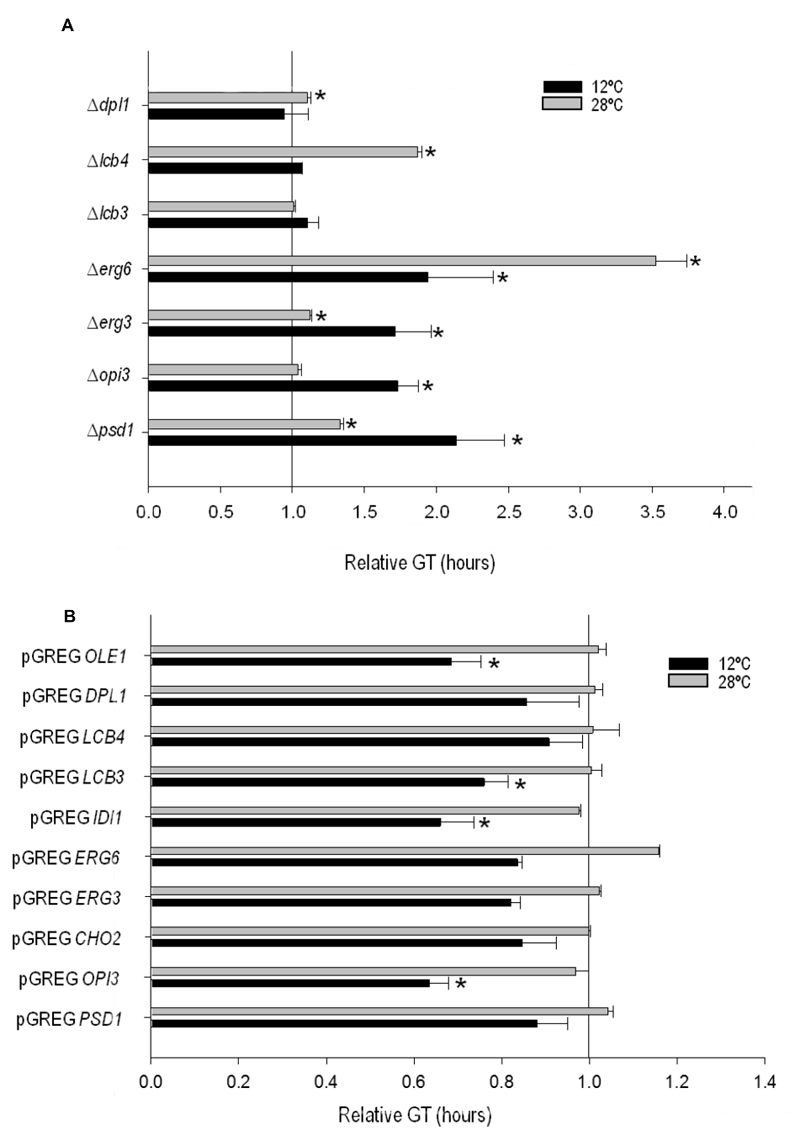
FIGURE 2: Generation time (GT) of (A) the mutant and (B) selected overexpressing strains grown at 12°C (black bars) and at 28°C (gray bars) normalized with the GT of their control strains hoQA23 and hoQA23-pGREG (normalized as value 1).
The GT for the control strains was as follows:
11.59 h ± 3.12 h and 3.48 h ± 0.06 h for hoQA23 and
13.83 h ± 0.05 h and 3.63 h ± 0.05 h for hoQA23-pGREG at 12°C and 28°C, respectively.
*Statistically significant differences (P-value ≤ 0.05) if compared with the control strain at the same temperature.