
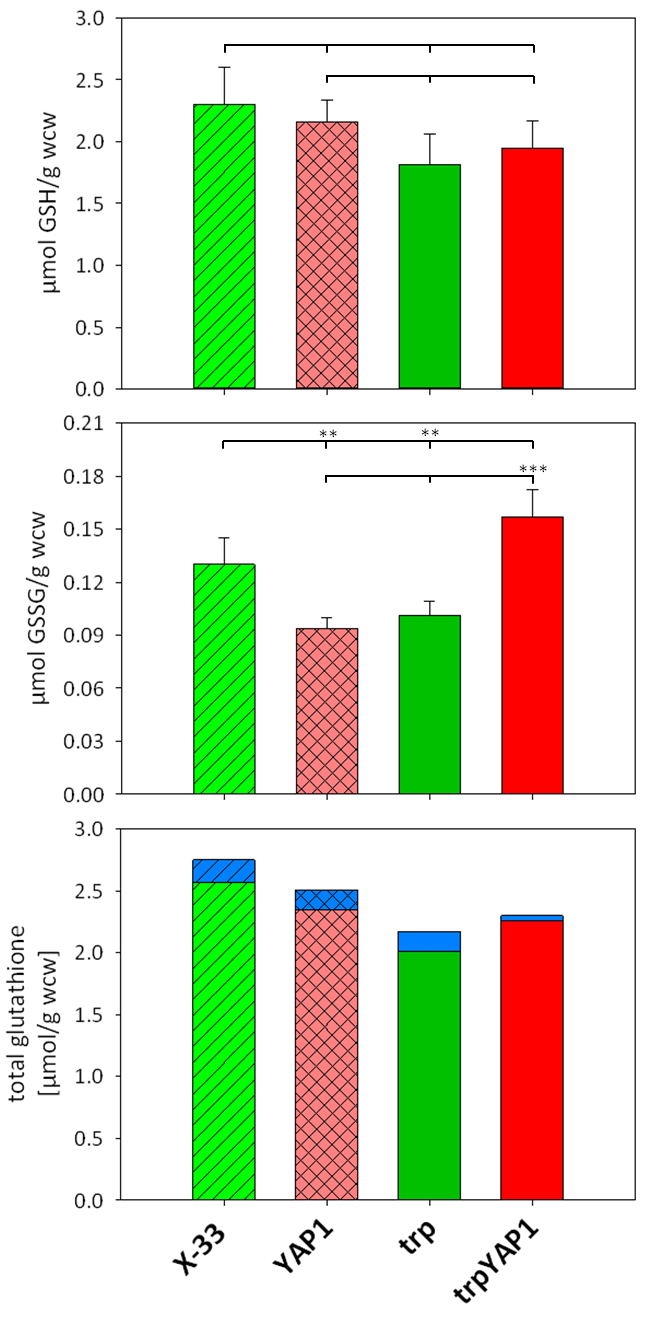
FIGURE 2: Comparison of intra- and extracellular glutathione (GSH) and glutathione disulfide (GSSG) levels in YAP1 overexpressing P. pastoris and controls.
Upper panel: Intracellular GSH concentrations (µmol GSH per gram wet cell weight). Differences were not statistically significant (P-values > 0.1).
Middle panel: Intracellular GSSG concentrations (µmol GSSG per gram wet cell weight). ** in the upper row indicate a significant difference to X-33 (P < 0.05). *** in the lower row indicates a significant difference to the trp strain (P < 0.01). Lower panel: Total glutathione (tGSH) concentration (intracellular: green (controls) or red (YAP1 overexpressing strains), excreted: blue) was determined using the equation tGSH = [GSH] + 2*[GSSG] .