
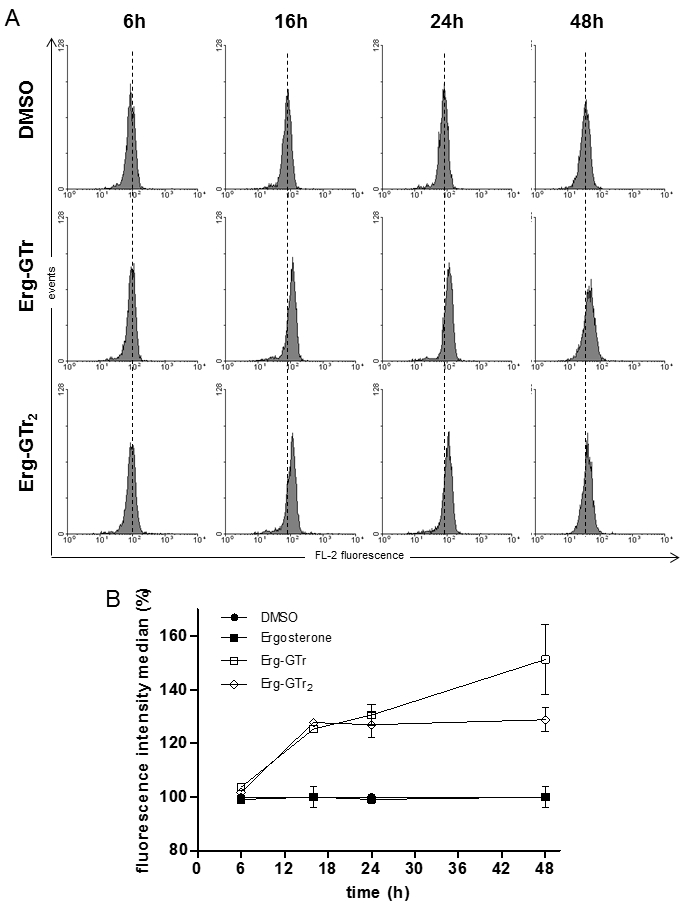
FIGURE 3: Mitochondrial membrane potential after Erg-GTr treatment.
(A) Histograms showing fluorescence intensity of parasites stained with Mitotraker Red CMXROS. Dashed line represents the histogram median of control cells. Right displacement indicates hyperpolarization. Histograms represent one of at least three experiments that showed the same tendency.
(B) Quantification of the fluorescence intensity median versus time. Changes in the fluorescence were calculated and represented in percentage, where the median values of control parasites means 100% fluorescence. Results show the mean +/- SD of three independent experiments.