
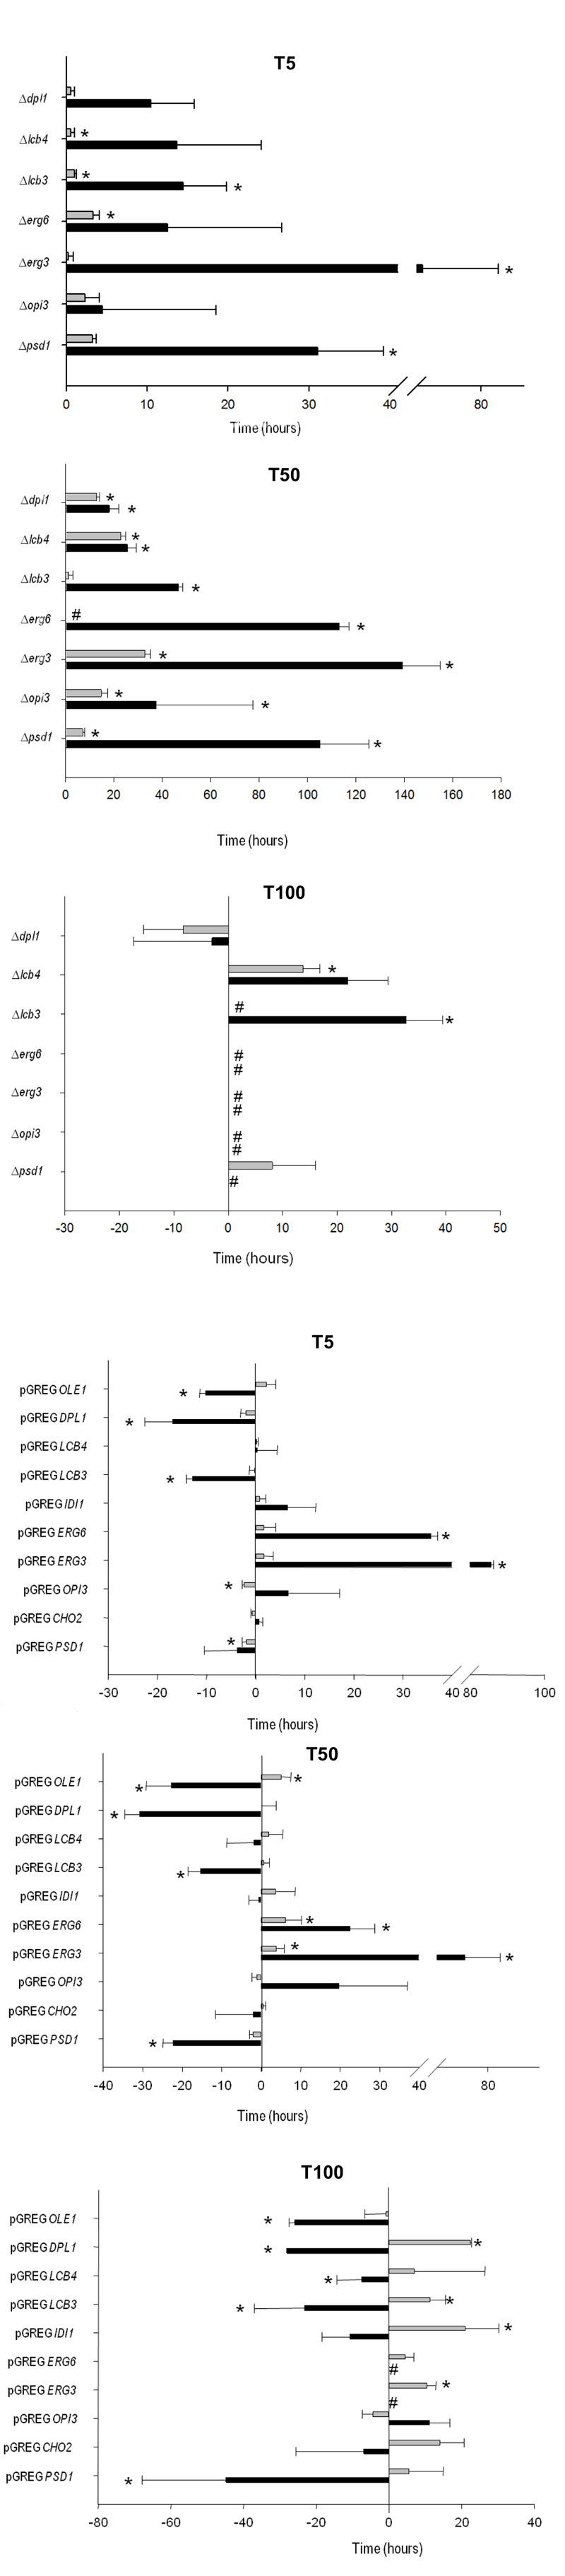
FIGURE 3: Determination of the time required by the mutant and the selected overexpressing strains to ferment 5% (T5), 50% (T50) and 100% (T100) of the initial sugar content in SM at 12°C (black bars) and 28°C (gray bars). Positive and negative values respectively represent the increases and decreases in time (hours) of the mutant and the overexpressing strains if compared to the control strains (normalized as value 0).
The fermentation time of the control strains are:
hoQA23
at 12°C T5 = 27 h ± 3.18 h, T50 = 96.19 h ± 3.97 h T100 = 251.44 h ± 10.34 h;
at 28°C T5 = 6.23 h ± 0.93 h, T50 = 44.95 h ± 0.93 h, T100 = 131.14 h ± 2.32 h and
hoQA23-pGREG
at 12°C T5 = 41.63 h ± 7.16 h, T50 = 119.81 h ± 11.93 h T100 = 271.69 h ± 21.48 h;
at 28°C T5 = 8.49 h ± 0.64 h, T50 = 38.40 h ± 1.56 h, T100 = 121.73 h ± 3.36 h.
# Indicates stuck fermentation before T50 or T100.
* Indicates statistically significant differences (P-value ≤ 0.05).