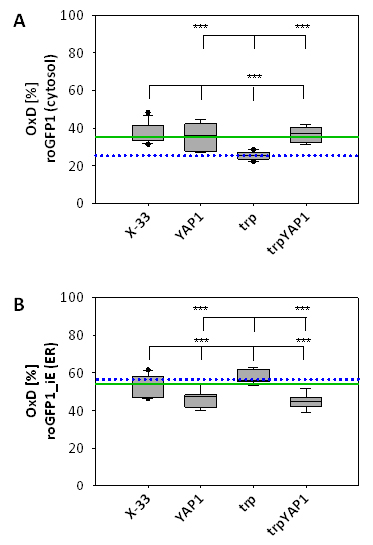
FIGURE 3: YAP1 co-overexpression with trypsinogen reoxidizes the cytosol redox state to the level of the wild type strain, while slightly reducing the ER redox ratio. The OxD obtained with roGFP are represented as Box-and-Whisker plots. Each box is separated into two inter-quartiles by the statistical median as a horizontal line in the box. The extreme values extending from the inter-quartile at most 1.5 times from the upper or lower inter-quartile are the ‘whiskers’. The green line indicates the median of X-33, the blue dotted line represents the median of the trp strain.
(A) Cytosolic redox ratios of the respective strains represented as OxD of roGFP. Statistical significance is indicated as for (B).
(B) ER redox ratios of the respective strains represented as OxD of roGFP-iE. *** in the lower row indicate a significant difference to X-33 (P < 0.01). *** in the upper row indicates a significant difference to the trp strain.

