
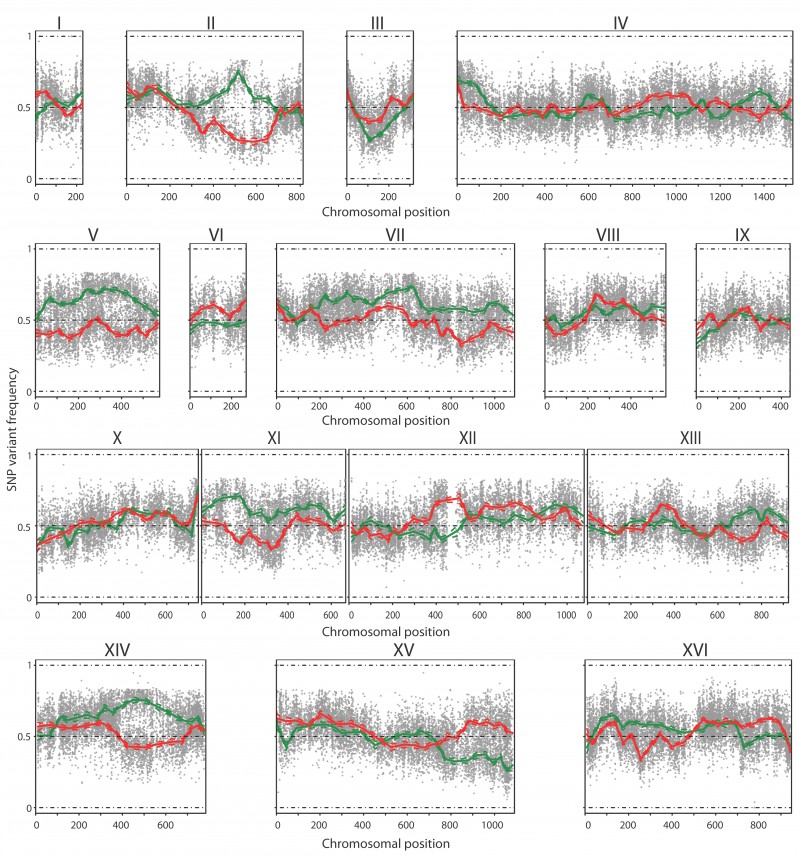
FIGURE 4: QTL mapping by pooled-segregant whole-genome sequence analysis of low ethyl acetate production. The SNP variant frequency was plotted versus the SNP chromosomal position for the 16 yeast chromosomes (raw data: grey circles for selected pool and grey triangles for random pool; smoothened data: solid green line for selected pool and solid red line for random pool; statistical confidence interval: dashed green and red lines). Significant upward deviation from 50% (>70%), indicating linkage to the genome of TDA1(4), was observed on chromosome II, V, VII, XI and XIV for the selected pool. Significant downward deviation from 50% (<30%), indicating linkage to the genome of ER7A, was observed on chromosome III and XV.