
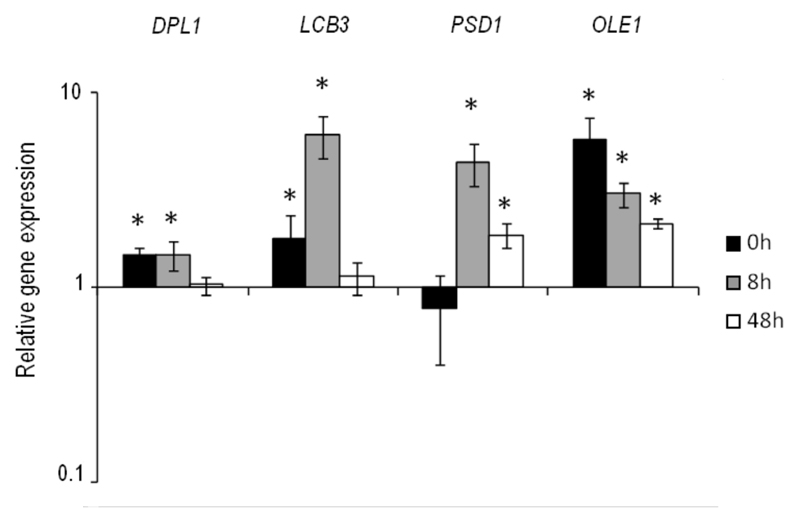
FIGURE 4: Relative expression of the overexpressed genes in the commercial wine yeast QA23. The differences in gene expression in the selected overexpressing strains are shown in relation to control QA23 (set as value 1). Values over 1 indicate higher gene expression than the control, whereas values under 1 indicate lower gene expression in comparison to the control.
*The results with statistically significant differences (P-value ≤ 0.05).