
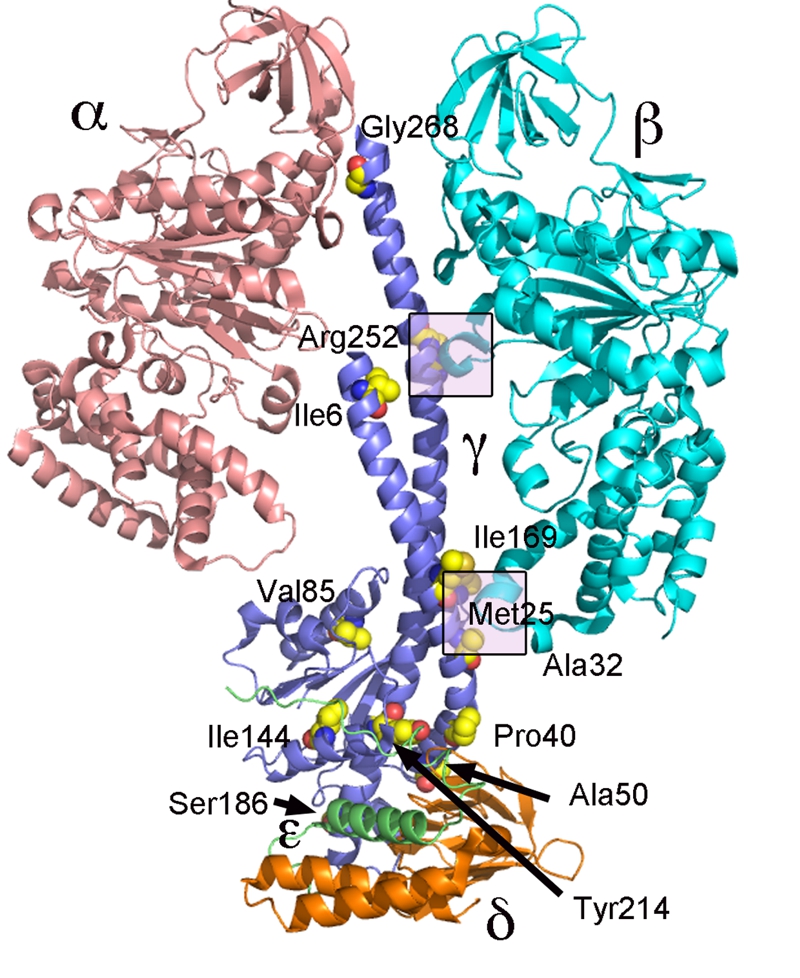
FIGURE 5: Relative location in the ATP synthase of residues mutated by known single nucleotide polymorphisms.
The structural representation is derived from the x-ray crystal structure of the bovine ATPase (1E79). To simplify the image, only a single copy of the α- (salmon) and β- (cyan) subunits is shown along with the γ- (purple), δ- (orange), and ε- (green) subunits. The residues, which are altered by known SNPs in the γ-subunit are shown in sphere representation and numbered using the human numbering system with 1 as the first residue in the mature peptide (the initiating Met is -25 for the γ-subunit). The two boxes represent the regions corresponding to Catch 1 and Catch 2 regions.