
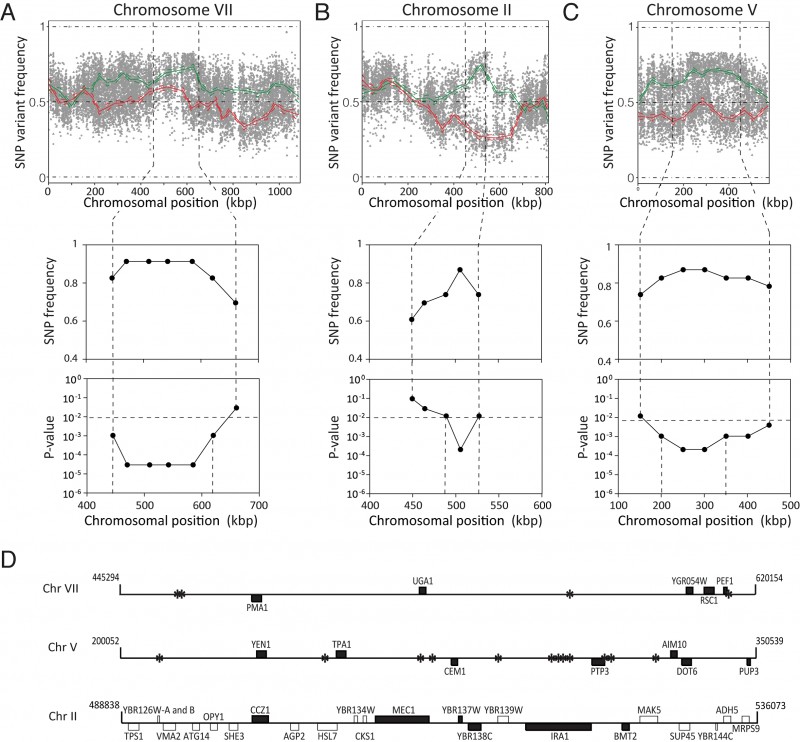
FIGURE 5: Fine mapping of QTLs on chromosome VII, II and V. Top: SNP variant frequency plotted versus SNP chromoso-mal position for chromosomes VII (A), II (B) and V (C) (raw data: grey circles for se-lected pool and grey triangles for random pool; smoothened data: solid green line for selected pool and solid red line for random pool; statistical confidence interval: dashed green and red lines). Middle and bottom: SNP frequency and associated p-value as determined by allele specific PCR in the 23 selected individual segregants (<16.3 mg/L ethyl acetate), in the indicated regions on chromosome VII (A), II (B) and V (C). The statistical confidence line (p-value ≤0.01) is also indicated. (D) Overview of intergenic regions (*) and genes present on chromosomes VII, II and V with a mutation in TDA1(4) (black bars) compared to S288c. For chromosome II the genes with a mutation in ER7A (white bars) compared to S288c are also indicated.