
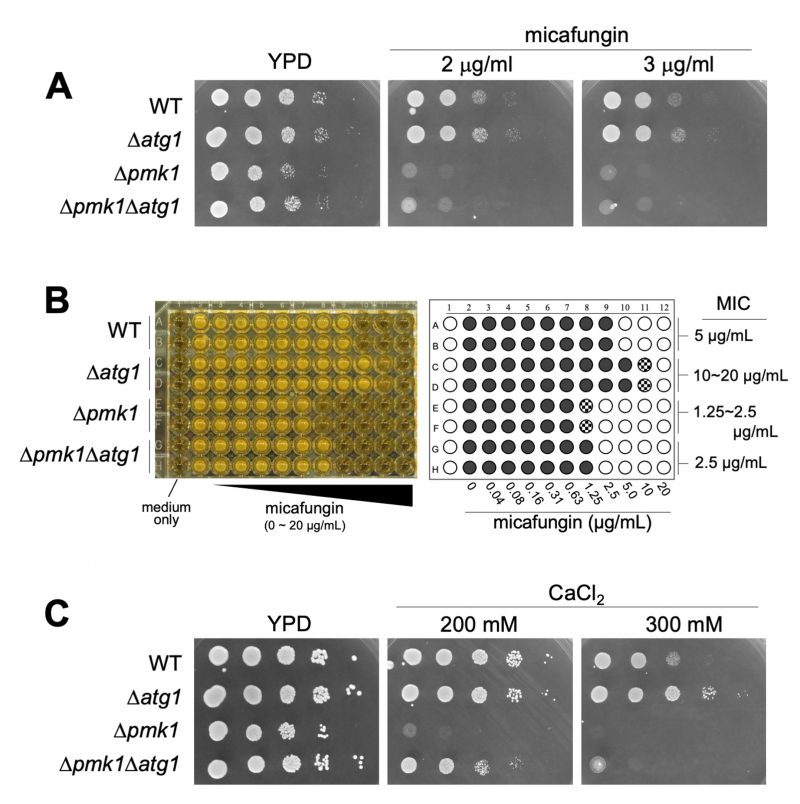
FIGURE 3: Δatg1 cells are resistant to micafungin and calcium. (A) Cells as indicated were serially diluted 100, 10−1, 10−2, 10−3, 10−4 and 5 µl were spotted onto YPD plates containing the indicated concentrations of micafungin. Plates were incubated at 27°C for 2 days. (B) Minimum Inhibitory Concentration (MIC) of micafungin. Cells as indicated were grown to mid-log phase and adjusted to OD660 = 0.5. The cells were then diluted 300-fold with fresh liquid YES and incubated in a 96-well plate with the indicated concentrations of micafungin for 2.5 days at 27°C. The most left wells contain medium only (sterility control). Right panel is a schematic illustration of the result of MIC assay. Open circle (○), closed circle (•), and shaded circle indicate no growth, full growth and a slight growth, respectively. (C) Cells as indicated were serially diluted 100, 10−1, 10−2, 10−3, 10−4 and 5 µL were spotted onto YPD plates containing the indicated concentrations of CaCl2. Plates were incubated at 27°C for 3 days.