
Back to article: Basal level of ppGpp coordinates Escherichia coli cell heterogeneity and ampicillin resistance and persistence
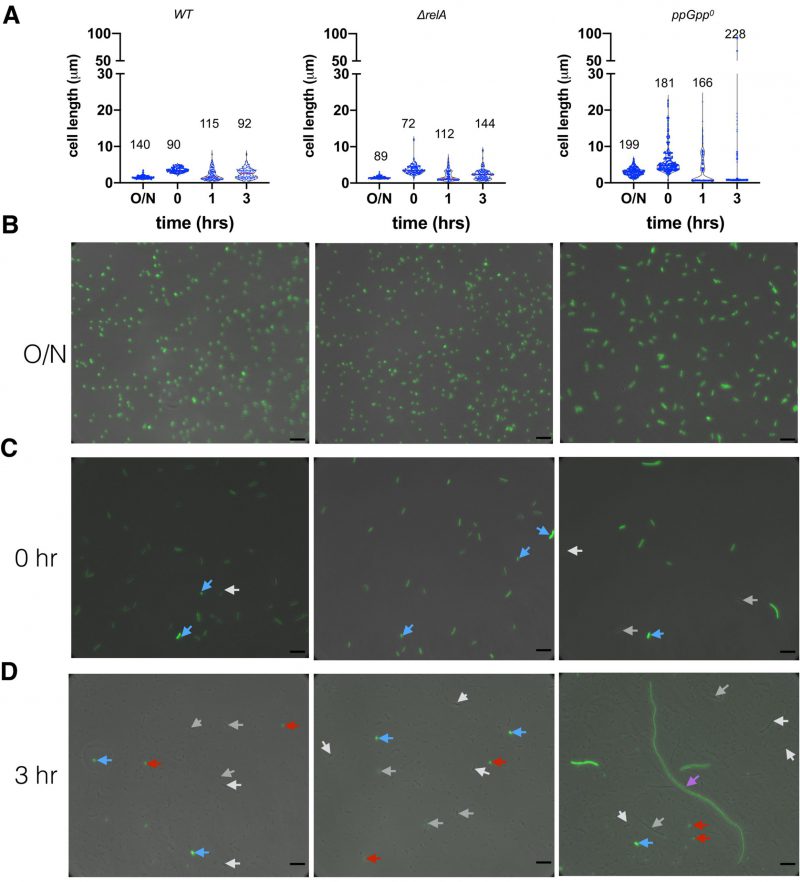
FIGURE 5: Heterogeneity of cells before and during ampicillin killing. (A) Violin plot of the cell length (µm) of the wt, ΔrelA and ppGpp0 cells under different conditions. O/N, 16-hr overnight cells in MOPSr-Lp medium; time point t0, 2.5 hr regrowth in fresh MOPSr-Lp medium from OD600nm 0.01; time points t1 and t3, cells after killing by ampicillin for 1 and 3 hrs respectively. The numbers of analyzed cells are indicated on top of the plots. (B, C, D) Representative microscopic pictures of cells at different time points. The phase contrast pictures are overlaid with the GFP fluorescence images. White and grey arrows, cells with no or low green fluorescence; blue arrow, potential overnight carry-over cells with strong green fluorescence; red arrow, dying round mini cells; magenta arrow, elongated cells of ppGpp0. Scale bars are 6 µm.