Research Articles:
Microbial Cell, Vol. 11, No. 1, pp. 265 - 277; doi: 10.15698/mic2024.07.831
Quantification methods of Candida albicans are independent irrespective of fungal morphology
1 Laboratory of Applied Microbiology, Department of Dental Materials and Prosthodontics, School of Dentistry, São Paulo State University (UNESP), Araraquara, Araraquara, São Paulo, Brazil. 2 Department of Oral Diagnosis, Piracicaba Dental School, State University of Campinas (UNICAMP), Piracicaba, São Paulo, Brazil. 3 Department of Social Dentistry, School of Dentistry, São Paulo State University (UNESP), Araraquara, Araraquara, São Paulo, Brazil.
Keywords: Candida albicans, yeasts, hyphae, cell count, colony count, microbial, polymerase chain reaction.
Received originally: 04/02/2024 Received in revised form: 09/06/2024
Accepted: 17/06/2024
Published: 26/07/2024
Correspondence:
Prof. Dr. Ewerton G de O Mima, Rua Humaitá, 1680, Centro, Araraquara, SP, Brazil. ZIP: 14801-903; Phone: +55-16-3301-6557; Fax: +55-16-3301-6406; ewerton.mima@unesp.br
Conflict of interest statement: Authors declare no conflict of interest.
Please cite this article as: Amanda B Soares, Maria C de Albuquerque, Leticia M Rosa, Marlise I Klein, Ana C Pavarina, Paula A Barbugli, Livia N Dovigo, Ewerton G de O Mima (2024). Quantification methods of Candida albicans are independent irrespective of fungal morphology. Microbial Cell 11: 265-277. doi: 10.15698/mic2024.07.831
Abstract
The ability of Candida albicans to switch its morphology from yeast to filaments, known as polymorphism, may bias the methods used in microbial quantification. Here, we compared the quantification methods [cell/mL, colony forming units (CFU)/mL, and the number of nuclei estimated by viability polymerase chain reaction (vPCR)] of three strains of C. albicans (one reference strain and two clinical isolates) grown as yeast, filaments, and biofilms. Metabolic activity (XTT assay) was also used for biofilms. Comparisons between the methods were evaluated by agreement analyses [Intraclass and Concordance Correlation Coefficients (ICC and CCC, respectively) and Bland-Altman Plot] and Pearson Correlation (α = 0.05). Principal Component Analysis (PCA) was employed to visualize the similarities and differences between the methods. Results demonstrated a lack of agreement between all methods irrespective of fungal morphology/growth, even when a strong correlation was observed. Bland- Altman plot also demonstrated proportional bias between all methods for all morphologies/growth, except between CFU/mL X vPCR for yeasts and biofilms. For all morphologies, the correlation between the methods were strong, but without linear relationship between them, except for yeast where vPCR showed weak correlation with cells/mL and CFU/mL. XTT moderately correlated with CFU/mL and vPCR and weakly correlated with cells/mL. For all morphologies/growth, PCA showed that CFU/mL was similar to cells/mL and vPCR was distinct from them, but for biofilms vPCR became more similar to CFU/mL and cells/mL while XTT was the most distinct method. As conclusions, our investigation demonstrated that CFU/mL underestimated cells/mL, while vPCR overestimated both cells/mL and CFU/mL, and that the methods had poor agreement and lack of linear relationship, irrespective of C. albicans morphology/growth.
INTRODUCTION
Candida albicans is a commensal fungal species that colonizes the human body, such as the skin and the oral, gastrointestinal, and genital mucosae, and its proliferation is controlled by the host’s immune system 1. However, under local or systemic conditions, such as diabetes, medication for cancer treatment, antibiotic therapy, xerostomia (low salivary flow), use of dental prostheses, and, mainly, immunosuppression, C. albicans becomes pathogenic, causing superficial infections (oral and vaginal candidiasis) or systemic and generalized infection (candidemia) 2, 3.
The opportunistic characteristic of C. albicans to undergo the transition from commensal to a pathogen is strongly associated with its ability to morphologically and reversibly switch between yeast and filamentous forms (hyphae and pseudohyphae), a property known as polymorphism (multimorphism or dimorphism), which is fundamental to its pathogenesis and its ability to form biofilms (microbial communities adhered to a surface and surrounded by a polymeric matrix mainly self-produced by the microbial cells) 4, 5. A yeast cell, blastopore or blastoconidia, consists of a single-cell or budding cell with a round-oval, well-defined shape. On the contrary, the filamentous forms are elongated and multicellular. Noteworthy, pseudohyphae is morphologically distinguishable from hyphae because the former has constrictions at the septation sites and is wider than hyphae, while the last shows parallel walls without constrictions at the septation site 4, 6 (Figure 1). Additionally, pseudohyphal cells are easily separated from each other by mechanical agitation 4. Despite those differences, the pseudohyphae form shares similar features from yeast and hyphae that raise questions about whether the former is a final morphology or only an intermediate state between the other two forms 7, 8. Another morphology, chlamydospore (resting spore), is also observed in mycelium at the distal end of filaments 9. Aside from these distinctive, well-written shapes, other yeast-like morphotypes have been documented for C. albicans [white (a or α), opaque (a or α), opaque (a/α), gray and gastrointestinally induced transition (GUT) cell types], then totalizing nine different morphologies demonstrating the remarkable plasticity of C. albicans 7.
–
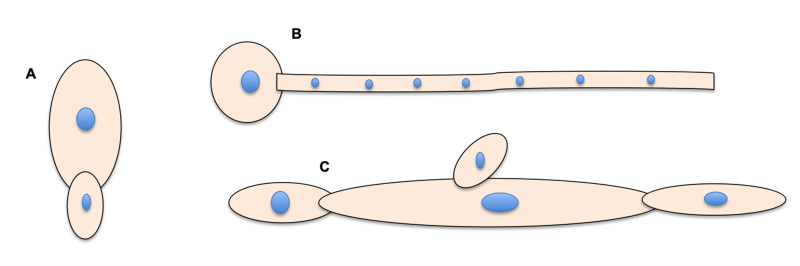 | FIGURE 1: Schematic representation of the morphological forms of yeast (A), hyphae (B), and pseudohyphae (C) of C. albicans. |
The transition from yeast to filaments can be triggered by a variety of stimuli such as body temperature (37°C), presence of serum, low nitrogen levels, presence of glucose, cell wall damage, embedded matrix environment, availability of amino acids, neutral pH, and microaerophilic conditions, such as 5% CO2 4, 6, 7. These stimuli induce signaling pathways, which include the cyclic adenosine monophosphate–protein kinase A (cAMP-PKA), the mitogen–activated protein kinase (MAPK), the Rim101-pH sensing, the Hog–MAPK, and the Tup1-mediated negative regulatory pathway resulting in expression of genes involved in hyphal morphogenesis and mycelium formation 4, 6, 7, 10. The filamentation is a relevant virulence factor of C. albicans also observed during the initiation step of biofilm formation5 and is essential for pathogenesis because hyphae can invade the host tissue by endocytosis or active penetration, causing superficial candidiasis 7, 10, 11. Also, when it reaches the bloodstream, it can switch back to yeast, facilitating the fungal spread to other locations in the body.
Various methods have been used to quantify microorganisms. Despite being a widely used method, the quantification by colony-forming units (CFU), or culture on agar, is considered slow, laborious, and less efficient than microscopic counts12, 13 and requires the biofilm’s disruption and cell disaggregation for clinical and laboratory samples. Other methods evaluate the microbial viability of intact biofilms based on the reduction (color change) of salts such as tetrazolium salts used to assess cellular metabolism and dyes such as resazurin, known as Alamar Blue 14. The quantification by Polymerase Chain Reaction (qPCR) is also employed, especially for non-culturable species, but this technique should avoid the amplification of non-viable cells and extracellular DNA (eDNA) 15, 16. Therefore, a membrane impermeative reagent such as ethidium monoazide (EMA) or propidium monoazide (PMA) that intercalates in the DNA of cells with damaged membrane and free DNA should be used and photoactivated before DNA extraction and amplification, which is termed viability PCR (vPCR) 15, 16.
Despite the diverse methods for microbial quantification, the quantification of filamentous fungi seems to be non-accurate. The different morphologies of C. albicans compromise the reproducibility of CFU since one single yeast produces one CFU, as does a single hypha or pseudohypha with several compartments and branches. However, if these compartments and branches are separated, they produce higher numbers of CFUs. Thus, the CFU value for a culture of C. albicans with mixed morphologies does not correspond to the exact number of cells, underestimating this value. Several studies have pointed out this shortcoming 17, 18, 19, 20, 21, but to the best of our knowledge, none have demonstrated it yet. Similarly, the vPCR of C. albicans does not correspond to the exact number of cells either since one single hypha will produce a value corresponding to the number of nuclei that this hypha has, overestimating the number of cells. However, no previous study demonstrated experimentally that morphologies of C. albicans can bias the accuracy of quantification methods. Therefore, this study compared the quantification methods of C. albicans in its different morphologies.
RESULTS
In this investigation, we employed three clinical strains of C. albicans (one reference and two clinical isolates) that were grown as yeasts, filaments, and biofilms and then submitted to different quantification methods (cells/mL, CFU/mL, and vPCR; biofilms were also quantified by metabolic activity using the XTT assay). The reference strain was also submitted to antifungal treatments [fluconazole and antimicrobial Photodynamic Therapy (aPDT)]. The methods of quantification were evaluated by agreement using the Intraclass Correlation Coeficient (ICC), Concordance Correlation Coeficient (CCC), and Bland-Altman plot. Pearson and Spearman correlation were also used to compare the methods and the differences and similarities between the methods were visualized by Principal Component Analysis (PCA, see Material and Methods for more details).
Figure 2 depicts the confocal images obtained for yeast of C. albicans used to quantify cells/mL (Figure S1 and S2 show images of filaments and biofilms, respectively). Cells were labeled as green (viable) and red (non-viable; see Materials and Methods). Initially, we also intended to quantify the number of nuclei (stained in blue) to compare it with the values of vPCR, but we observed non-specific blue labeling outside the cells (probably the eDNA, Figure 2B), which hindered the nuclei quantification on microscopic images. aPDT and fluconazole resulted in reductions from 0 to 1.66 log10(CFU/mL) (Table 1). We described below the agreement and correlation analyses for each morphology/growth.
–
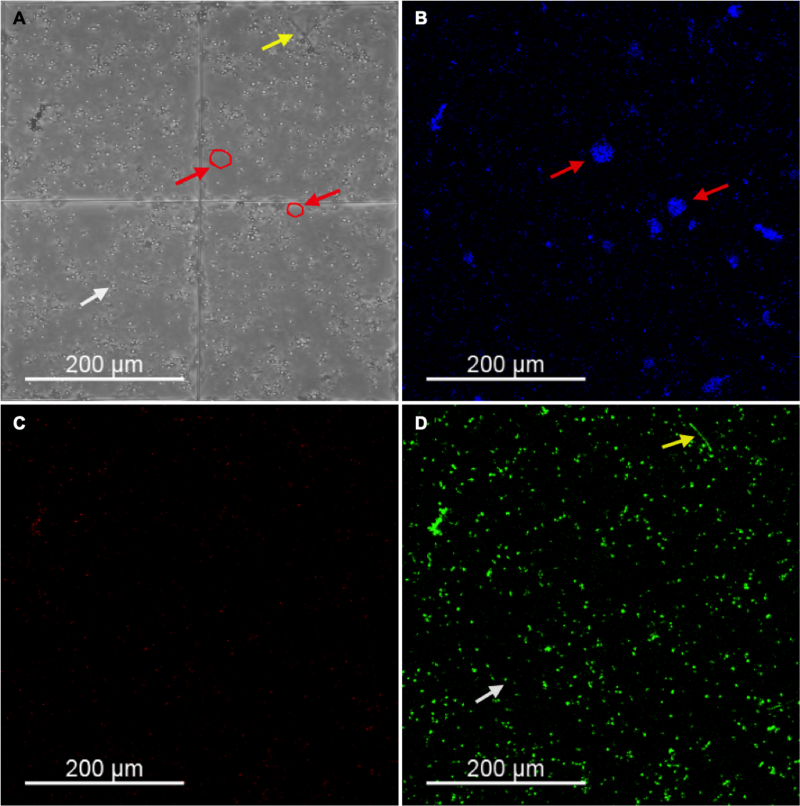 | FIGURE 2: Confocal images obtained for yeast growth of C. albicans SC5314. Bright-field (A) and fluorescence mode for Hoescht 33342 (nuclei in blue, (B)), propidium iodide (non-viable cells in red, (C)), and concanavalin A – Alexa Fluor 488 conjugate (viable cells in green, (D)). Red arrows show non-specific extracellular labeling of Hoescht 33342, white arrows show yeast cells and yellow arrows show filaments. |
Table 1. Reductions [mean ± standard deviation in log10(CFU/mL)] of C. albicans submitted to aPDT* and 1 μg/mL fluconazole.
|
Growth/Treatment |
Yeast |
Filament |
Biofilm |
|---|---|---|---|
|
aPDT |
1.66 ± 0.26 |
1.59 ± 0.16 |
0.82 ± 0.40 |
|
fluconazole |
0.81 ± 0.30 |
0.39 ± 0.38 |
0 |
* curcumin at 0.5 μM incubated for 5 min followed by illumination at 3.62 J/cm2 for yeast and filaments. Curcumin at 1 μM incubated for 10 min followed by illumination at 5 J/cm2 for biofilm.
Yeast
Log10(CFU/mL) and log10(cells/mL) values showed a good agreement (ICC = 0.75, Table 2) by the ICC [but with a wide Confidence Interval (95% CI)], and poor agreement (CCC = 0.60, Table 2) by the CCC. Wide limits of agreement seen in the Bland-Altman plot (Figure 3A) also suggested a proportional bias between the methods: i.e. the higher the mean values between cells/mL and UFC/mL, the lower the difference between the methods. Differences between CFU/mL and cells/mL values indicated higher values of cells/mL compared with their respective CFU/mL. The dissimilar results obtained for ICC demonstrated the importance of performing different tests to analyze agreement. The correlation between the methods (Figure 3D) was strong (r = 0.88) and significant (p < 0.001) (Table 2), which suggested a high degree of linear association between the two methods. However, the assumptions of regression were not met, considering the non-independence of residuals (Durbin-Watson = 1.1, Table 2) and violation of linearity and homocedasticity, which was visualized by the conical shape of the residual-versus-predicted plot (Figure S3A). Therefore, we could not fit a model to our data that would predict the values of cells/mL based on the values of CFU/mL.
–
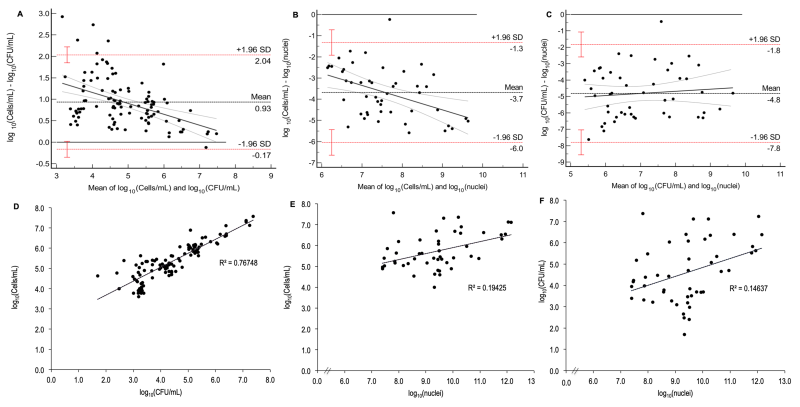 | FIGURE 3: Bland-Altman plots and correlation analyses between the methods of cells/mL, CFU/mL, and vPCR (nuclei quantification) for yeast growth. The Bland-Altmand plots between cells/mL and CFU/mL (A), vPCR and cells/mL (B), and vPCR and CFU/mL (C) demonstrated lack of agreement, since dots are not evenly distributed around the mean line (black horizontal dotted line); red horizontal dotted lines: limits of agreement (standard deviation, SD), red whiskers: 95% CI of the limits of agreement; black continuos line: regression line showing the proportional bias in (A) and (B). Correlations between cells/mL and CFU/mL (D), vPCR and cells/mL (E), and vPCR and CFU/mL (F). The coeficient of determination (R2) shows that 77% of variation in cells/mL is explained by CFU/mL, while only 19% and 15% of variation in cells/mL and CFU/mL, respectively, are explained by vPCR data (nuclei quantification). Data were log10-transformed for all assays. |
When log10 data from vPCR were compared with log10(cells/mL), a poor agreement was observed (ICC = 0.12; CCC = 0.06, Table 2), with vPCR overestimating cells/mL (Figure 3B), as well as a proportional bias between the methods; i.e., the higher the values of vPCR and cells/mL, the higher the difference (in modulus) between the methods. The same trend was observed when comparing vPCR and log10(CFU/mL) since poor agreement was observed (ICC = 0.10; CCC = 0.05, Table 2). The Bland-Altman plot (Figure 3C) also demonstrated that vPCR overestimated CFU/mL (lack of agreement) but without proportional bias. The correlation was significant and weak for both vPCR versus cells/mL (p = 0.001; r = 0.44, Figure 3E, Table 2) and vPCR versus CFU/mL (p = 0.004, r = 0.38, Figure 3F, Table 2). However, the assumption of linearity was violated (Figure S3B and C), which precluded a regression model for each comparison, although the indepence of residuals was acceptable (Durbin-Watson = 1.8 and 1.5 for vPCR versus cells/mL and vPCR versus CFU/mL, respectively, Table 2).
Table 2. Summary of the agreement and correlation analyses between the quantification methods obtained for all morphologies/growths of C. albicans.
|
Morphology/ Growth |
Methods |
ICC [95% CI] |
CCC [95% CI] |
Correlation |
Regression |
|
|---|---|---|---|---|---|---|
|
|
|
|
|
r |
p value |
Durbin-Watson |
|
Yeast |
cells/mL versus CFU/mL |
0.75 [-0.19, 0.92] |
0.60 [0.51, 0.68] |
0.88 |
< 0.001 |
1.103 |
|
cells/mL versus vPCR |
0.12 [-0.08, 0.39] |
0.06 [0.02, 0.10] |
0.44 |
0.001 |
1.763 |
|
|
vPCR versus CFU/mL |
0.10 [-0.07, 0.35] |
0.05 [0.01, 0.09] |
0.38 |
0.004 |
1.494 |
|
|
Filament |
cells/mL versus CFU/mL |
0.69 [-0.19, 0.91] |
0.53 [0.44, 0.61] |
0.88 |
< 0.001 |
1.645 |
|
cells/mL versus vPCR |
0.20 [-0.10, 0.54] |
0.11 [0.06, 0.16] |
0.81 |
< 0.001 |
1.087 |
|
|
vPCR versus CFU/mL |
0.23 [-0.04, 0.60] |
0.13 [0.07, 0.18] |
0.83 |
< 0.001 |
1.222 |
|
|
Biofilm |
cells/mL versus CFU/mL |
0.73 [-0.05, 0.90] |
0.58 [0.47, 0.67] |
0.79 |
< 0.001 |
0.747 |
|
cells/mL versus vPCR |
0.22 [-0.07, 0.58] |
0.12 [0.07, 0.17] |
0.83 |
< 0.001 |
1.234 |
|
|
vPCR versus CFU/mL |
0.21 [-0.03, 0.59] |
0.12 [0.07, 0.17] |
0.81 |
< 0.001 |
1.007 |
|
|
XTT versus cells/mL* |
0.12 [-0.09, 0.38] |
0.06 [0.03, 0.09] |
0.48 |
< 0.001 |
1.530 |
|
|
XTT versus CFU/mL* |
0.13 [-0.04, 0.41] |
0.07 [0.04, 0.09] |
0.65 |
< 0.001 |
1.283 |
|
|
XTT versus vPCR* |
0.11 [-0.03, 0.40] |
0.06 [0.03, 0.09] |
0.74 |
< 0.001 |
2.086 |
|
95% CI: 95% ConfidenceInterval; ICC: Intraclass Correlation Coefficient; CCC: Concordance Correlation Coefficient.
*: data were normalized by their maximum value for agreement analysis (ICC and CCC).
Filaments
The point estimate ICC between the log10(CFU/mL) and log10(cells/mL) values for filaments indicated moderate agreement with wide confidence limits (ICC = 0.69, Table 2), while the CCC showed poor agreement (CCC = 0.53, Table 2). The Bland-Altman analysis (Figure 4A) revealed a lack of agreement and proportional bias between the methods, i.e., CFU/mL underestimated cells/mL and the higher their values, the lower the differences between them. The methods also showed a significant strong correlation (p < 0.001, r = 0.88, Figure 4D, Table 2), but a regression model could not be estimated due to non-linearity and heteroscedasticity (Figure S3D), although independence of residuals was met (Durbin-Watson = 1.65, Table 2).
–
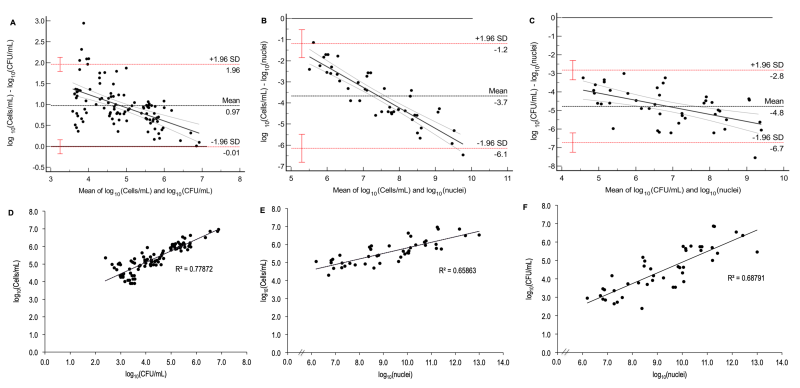 | FIGURE 4: Bland-Altman plots and correlation analyses between the methods of cells/mL, CFU/mL, and vPCR (nuclei quntification) for filament growth. The Bland-Altmand plots between cells/mL and CFU/mL (A), vPCR and cells/mL (B) and vPCR and CFU/mL (C) demonstrated lack of agreement, since dots are not evenly distributed around the mean line (black horizontal dotted line); red horizontal dotted lines: limits of agreement (standard deviation, SD), red whiskers: 95% CI of the limits of agreement; black continuos line: regression line showing the proportional bias with the differences between cells/mL and CFU/mL tend to zero as their averages (and values) increase in (A), while the differences between cells/mL and nuclei and also between CFU/mL and nuclei augment (in modulus) as their averages (and values) increase and this trend is more pronounced between cells/mL and nuclei. Correlations between cells/mL and CFU/mL (D), vPCR and cells/mL (E), and vPCR and CFU/mL (F). The coeficient of determination (R2) shows that 78% of variation in cells/mL is explained by CFU/mL, 66% and 69% of variation in cells/mL and CFU/mL, respectively, are explained by vPCR data (nuclei quantification). Data were log10-transformed for all assays. |
Log10(cells/mL) and vPCR showed poor agreement (ICC = 0.20; CCC = 0.11, Table 2). The Bland-Altman analysis (Figure 4B) also evidenced a lack of agreement and proportional bias, which means that vPCR overestimated cells/mL and the difference between them increased (in modulus) as their values increased. Similar results were observed when comparing log10 data from vPCR and log10(CFU/mL), since both ICC and CCC demonstrated poor agreement between the methods (0.23 and 0.13, respectively, Table 2). The Bland-Altman plot (Figure 4C) showed a lack of agreement and proportional bias, with vPCR overestimating CFU/mL and higher values showing higher differences (in modulus) between the methods. The correlation was significant (p < 0.001) and strong for both vPCR versus cells/mL (r = 0.81, Figure 4E, Table 2) and vPCR versus CFU/mL (r = 0.83, Figure 4F, Table 2). The residual-versus-predicted plots (Figure S3E and F) demonstrated dots symmetrically distributed around the center line of zero, suggesting linearity. However, the assumption of independence of residuals was violated for both comparisons (Dubin-Watson = 1.09 and 1.22 for vPCR versus cells/mL and vPCR versus CFU/mL, respectively, Table 2).
Biofilms
According to the point estimate ICC, the agreement between log10(cells/mL) and log10(CFU/mL) was good (0.73, Table 2), but the lower limit of 95% CI was close to zero. CCC showed poor agreement (0.58, Table 2), and the Bland-Altman analysis demonstrated a lack of agreement between these methods with proportional bias (Figure 5A). Therefore, owing to the negative difference between CFU/mL and cells/mL, the former underestimated the last. Moreover, higher values of both methods showed lower difference between them trending toward zero. These methods showed a strong and significant correlation (r = 0.79, p < 0.001, Figure 5G, Table 2), but their data violated the assumptions of independence of residuals (Durbin-Watson = 0.75, Table 2), linearity, and homocedasticity (Figura S3G) of linear regression.
–
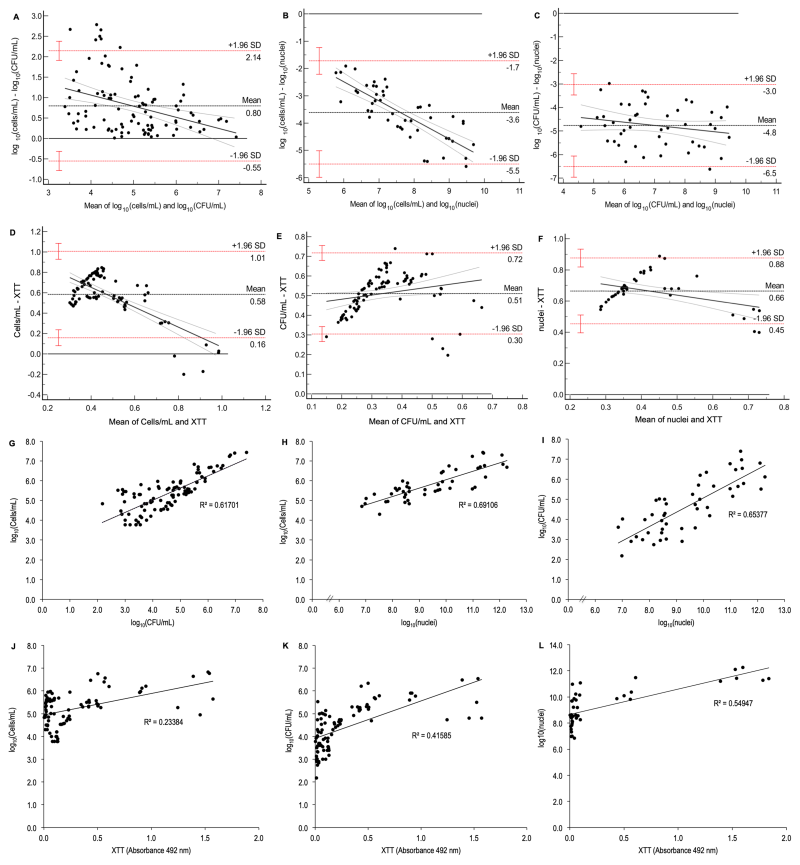 | FIGURE 5: Bland-Altman plots and correlation analyses between the methods of cells/mL, CFU/mL, vPCR, and metabolic activity (XTT assay) for biofilms. Bland-Altmand plots between cells/mL and CFU/mL (A), vPCR and cells/mL (B), vPCR and CFU/mL (C), XTT and cells/mL (D), XTT and CFU/mL (E), and XTT and vPCR (F) demonstrated lack of agreement, since dots are not evenly distributed around the mean line (black horizontal dotted line); red horizontal dotted lines: limits of agreement (standard deviation, SD), red whiskers: 95% CI of the limits of agreement; black continuos line: regression line showing the proportional bias with the differences between cells/mL and CFU/mL tend to zero as their averages (and values) increase in (A), while the differences between cells/mL and nuclei and also between CFU/mL and nuclei augment (in modulus) as their averages (and values) increase and this trend is more pronounced between cells/mL and nuclei. Correlations between cells/mL and CFU/mL (G), vPCR and cells/mL (H), vPCR and CFU/mL (I), XTT and cells/mL (J), XTT and CFU/mL (K), and XTT and vPCR (L). The coeficient of determination (R2) shows that 62%, 69%, but only 23% of variation in cells/mL is explained by CFU/mL, vPCR, and XTT, respectively, 65% and 42% of variation in CFU/mL is explained by vPCR and XTT, respectively, and 55% of variation in vPCR is explained by XTT. Data were log10-transformed (except for XTT) for (A), (B), (C), (G), (H), (I), (J), (K), and (L) and data were normalized for their maximum value for the concordance analysis of XTT (D, E, and F). |
The agreement between log10 data from vPCR and cells/mL was poor for both ICC (0.22, Table 2) and CCC (0.12, Table 2). Also, the Bland-Altman plot (Figure 5B) showed a lack of agreement and proportional bias, with vPCR overestimating cells/mL and the difference between the methods increasing (in modulus) proportionally to their values. When vPCR was compared with log10(CFU/mL), a poor agreement was also verified by ICC (0.21, Table 2) and CCC (0.12, Table 2). The Bland-Altman plot (Figure 5C) demonstrated a lack of agreement but without proportional bias between the methods. Thus, vPCR overestimated CFU/mL without systematic error. The correlation was significant (p < 0.001) and strong for both vPCR versus cells/mL (r = 0.83, Figure 5H, Table 2) and vPCR versus CFU/mL (r = 0.81, Figure 5I, Table 2). However, the assumption of independence of residuals was violated (Durbin-Watson = 1.23 and 1.01 for vPCR versus cells/mL and vPCR versus CFU/mL, respectively, Table 2) for regression model, although linearity was observed for both comparisons (Figure S3H and I).
The metabolic activity (XTT assay) was also assessed for biofilms, and the data of all quantification methods were transformed (normalization by their maximum values, see Methods section) for the agreement analyses. XTT demonstrated poor agreement with all other methods (cells/mL, CFU/mL, and vPCR, ICC = 0.12, 0.13, and 0.11, respectively, and CCC = 0.06, 0.07, and 0.06, respectively, Table 2). The Bland-Altman plots confirmed lack of agreement between XTT and all the other methods with proportional bias (Figure 5D, E, and F). The values obtained in the XTT assay were significantly correlated (p < 0.001) with all other quantification methods (cells/mL, CFU/mL, and vPCR), the correlation was weak between XTT and cells/mL (r = 0.48, Figure 5J, Table 2) and moderate between XTT and CFU/mL (r = 0.65, Figure 5K, Table 2), and XTT and vPCR (r = 0.74, Figure 5L, Table 2). Data did not meet the assumption of linearity (Figure S3J-L), although independence of residuals was observed for XTT versus cells/mL and XTT versus vPCR (Durbin-Watson = 1.53 and 2.09, respectively, Table 2), but not for XTT versus CFU/mL (Durbin-Watson = 1.28, Table 2).
Principal Component Analysis (PCA)
Additionally, PCA was performed for all morphologies/growths (Figure 6A) encompassing the methods of cells/mL, CFU/mL, and vPCR in order to visualize the similarities and differences between the methods. PCA is a multivariate approach aimed at reducing the number of variables by producing components (linear combinations of the original variables) with the majority of variation from the original data, enabling the visualization of trends and patterns. Here, we also performed PCA for biofilms to include the XTT assay (Figure 6B). The oblique Oblimin rotation was used to determine which component the variables were responsible for. The PCA for all morphologies/growths evidenced that only one principal component accounted for 83.23% of the variance (Eigenvalue of 2.5). However, we extracted a second principal component, which accounted for 13.22% of the variance (Eigenvalue of 0.4), to generate a component plot for visualizing the variables (2-component solution, Figure 6C). The component plot demonstrated that the methods of cells/mL and CFU/mL were more similar to each other and loaded highly on component 1, while vPCR was a distinct method loading high on component 2. When only biofilms were evaluated, the principal component 1 was responsible for 83.95% of the variance (Eigenvalue = 3.36) and the principal component 2 accounted for 7.93% of the variance (Eigenvalue = 0.317). The component plot (Figure 6D) evidenced that vPCR was more similar to CFU/mL and cells/mL, and these three methods loaded highly on component 1, while XTT was a different method loading more on component 2.
–
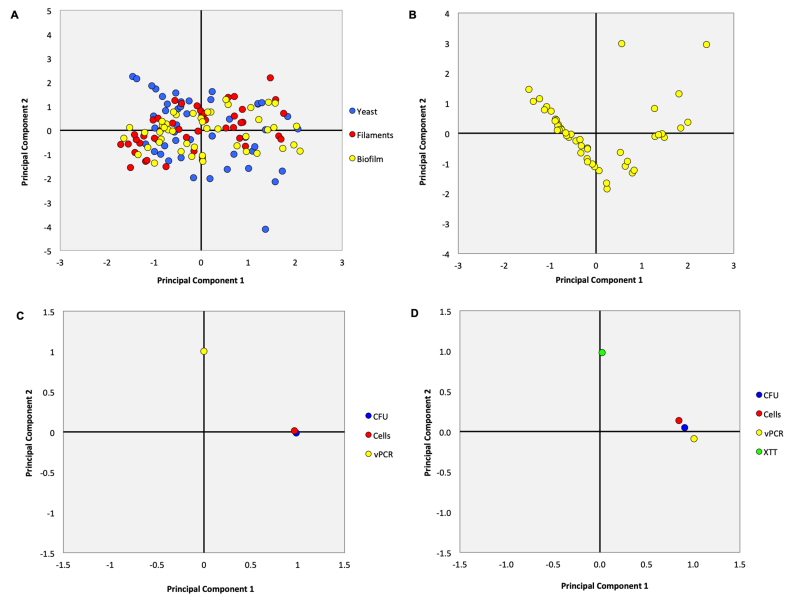 | FIGURE 6: Principal Component Analysis (PCA) performed for all morphologies/growth (yeasts, filaments, and biofilms) involving the methods of cells/mL, CFU/mL, and vPCR (A) and also only for biofilms to include the XTT assay (B). After Oblimin rotation, PCA showed that cells/mL and CFU/mL were more similar to each other and loaded highly on component 1, while vPCR was a different method and loaded highly on component 2 for all morphologies/growths (C); for biofilms, vPCR became more similar to CFU/mL and cells/mL and loaded highly on component 1, while XTT was the most distinct method loading highly on component 2. |
DISCUSSION
Although several investigations suggested that the filament form of C. albicans would compromise the accuracy of CFU method 17, 18, 19, 20, 21, our investigation demonstrated that the methods of quantification differ from each other irrespective of the fungal morphology. Even the yeast form, which is a mononuclear cell, showed a lack of agreement between all the quantification methods (cells/mL, CFU/mL, and vPCR) assessed by all the statistical tests employed (ICC, CCC, and Bland-Altman). The only exception observed was the ICC that demonstrated moderate/good agreement between cells/mL and CFU/mL of yeasts, filaments, and biofilms, contradicting the results obtained by CCC and Bland-Altman for the same quantification methods. However, the 95% CI from ICC was wide and showed some values near to zero, indicating that the estimate was quite inaccurate. Conversely, CCC measures the agreement considering both precision (ρ) and accuracy (Cβ). Therefore, our study demonstrated the relevance of using different methods to evaluate agreement, since each statistical test employs different statistical approaches to evaluate agreement. Therefore, in this investigation, we aimed to evaluate agreement from different perspectives in order to have a more comprehensive view of the evidence. The lack of agreement between the tests was confirmed by the Bland-Altman plots, which evidenced that CFU/mL underestimated cells/mL with proportional bias (higher values showed lower differences towards zero). This proportional bias may be due to the difficulty in counting high numbers of colonies and cells in samples at high concentrations, as opposed to easily counting a few colonies and cells in samples at low concentrations, when the differences between the methods become more evident.
Despite the lack of agreement, cells/mL and CFU/mL demonstrated significantly strong correlations for all morphologies/growth (yeast, filament, and biofilm). However, it is important to emphasize that correlation does not evaluate agreement, but rather the strength of the relationship between the methods 22. Therefore, our investigation also showed the relevance of the agreement analyses when comparing methods, which should be evaluated by correlation but also, and most importantly, by different agreement tests. In spite of the strong correlation, it was not possible to obtain a regression model to predict the number of cells/mL based on CFU/mL because the assumptions of linear regression, such as independence of residuals, homocedasticity, and linearity, were violated.
Some investigations pointed out that quantification by PCR is more accurate 23, 24. In order to avoid the amplification of DNA from non-viable cells and eDNA and, consequently, overestimation in quantification, it is mandatory to use an intercalating dye (EMA or PMA) 15, 16. Moreover, normalizing the PCR copy numbers by genome size and genome copy number of the amplified gene is another important requirement to estimate the number of nuclei 25, 26. However, our investigation demonstrated that vPCR did not agree with and overestimated the other quantification methods (cells/mL and CFU/mL). This result was expected, especially for filaments and biofilms, because of the multinuclear characteristic of hyphae and pseudo-hyphae that results in higher values in vPCR. Even quantification of the yeast samples by vPCR resulted in overestimation, which may be justified by some budding yeast and some cells transitioning to filamentation (germ tubes), although all precautions were taken during the experiments to avoid such transition, such as control of temperature and use of specific culture medium. However, the growth of planktonic cultures (yeasts and filaments) did not show a “pure” morphology, with some cells displaying another morphology despite being a minority, which was a limitation of our study (Figures 2 and S1).
Another factor that may contribute to the lack of agreement between vPCR and the other methods is the DNA replication. To quantify the number of cells undergoing DNA replication precisely, cells should be separated based on the phases of their cell cycle (G0/G1, S, and G2M) using flow cytometry. This was conventionally established with the budding yeast Saccharomyces cerevisiae and requires cell synchronization, which is not easy with the polymorphic (or multimorphic) C. albicans because its different morphologies (yeast, hyphae, and pseudohyphae) show distinct cell cycles 27. Only a recent study described a protocol for synchronizing C. albicans cell cycle phases to be analyzed in flow cytometry 27. Since it was not possible to consider the DNA replication in our vPCR data, it could be considered a limitation of our study. The overestimation also showed proportional bias, evidencing that high values increased the difference (in modulus) between the vPCR and the other methods (cells/mL and CFU/mL) for all morphologies/growth and this trend was more pronounced between cells/mL and vPCR. The only exception was observed between vPCR and CFU/mL for yeasts, in which proportional bias was not observed, probably because the increase in the number of nuclei would be proportional to the number of colonies. However, the correlation between these methods was weak, evidencing that the relationship between the methods was weak, which was also observed for vPCR and cells/mL for yeast. Conversely, for filaments and biofilms, the correlation of vPCR and the other methods (cells/mL and UFC/mL) was strong, suggesting that the abundant presence of hyphae and pseudohyphae in the sample strengthened the relationship with vPCR. However, even when a strong and significant correlation was oberved, the assumptions of linear regression were not met, precluding obtaining a predictive model.
The XTT assay has been used as a viability test for biofilms, especially for susceptibility tests, because it is feasible and does not require disrupting the biofilm 21, 23. However, our results demonstrated that XTT did not agree with any of the other methods used. This finding may be explained by the low values of absorbance verified for most of the samples, which were diluted to reach concentrations between 103 to 105 CFU/mL and showed absorbance values lower than 1.0 a.u. (arbitrary units), whose differences with the other methods increased proportionally with their values. Conversely, only the samples at the highest concentration (non-diluted samples, i.e., samples at 107 to 106 CFU/mL) with higher absorbance values (above 1.00 a.u) showed lower difference with the other methods inversely proportional to their values. This change in the data pattern is easily seen in the Bland-Altman plots (Figure 5D-F) and explains the lack of agreement and the proportional bias observed. In addition, the metabolic activity of biofilms correlated significantly and moderately with the CFU/mL and vPCR but weakly with cells/mL. Such correlations resulted from the discrepancy between the absorbance values observed for most of the samples at lower concentrations and those at the highest concentrations. Noteworthy, we did not perform the XTT assay on sessile cells of biofilms since the same samples had to be submitted to all quantification tests, and the presence of XTT could have affected the results of the other tests. Consequently, the XTT assay was performed on loosed biofilm cells, which were disrupted, sonicated, and resuspended, and this could be considered another limitation of this assay in this investigation, considering that the sessile cells on biofilms show different stages of metabolic activity, including dormant cells (persisters) 28.
Data from the antifungal treatments (fluconazole and aPDT) were not evaluated individually because they did not meet the assumption of normality, even after log10 transformation, and the values obtained in these assays were similar to those from untreated samples since sub-lethal doses of antifungal treatments were employed. Therefore, we decided to pool the data and increase the sample size for the statistical analyses. Other studies verified the effect of antifungal treatments on quantification of C. albicans 19, 20, 23 and concluded that the qPCR was superior to XTT to evaluate the in vitro antifungal activity against mature biofilm23 and a bioiluminescence method was more reliable than CFU to quantify C. albicans load after antifungal treatment in vivo 19, 20. However, these studies did not perform agreement analyses but only correlation and comparisons (t test, ANOVA) between the methods.
It is important to mention that the analyses performed with the obtained data have enabled an understanding of how correlated and consistent the different methods are with each other, considering the type of culture. Our study did not aim to determine which method is the most accurate in itself; therefore, ranking them could extend beyond what our analyses would permit. However, to enhance understanding of the relationship between the methods, we conducted the PCA. According to PCA, the quantification methods can be ranked in the following order: 1. Cells/mL, 2. CFU/mL, 3. vPCR, and 4. XTT (for biofilms). Nonetheless, our investigation does not intent to suggest a “silver bullet” method for C. albicans quantification because all methods may be used considering that researchers should be aware of the limitations of each method, such as time, cost, and accuracy, and also consider the research scenario (in vitro, in vivo, or clinical trial). For example, in clinical trials of candidemia, which is a life-threatening condition, a faster but higher cost method, such as vPCR, may be used instead of slow and laborious methods, such as CFU. On the other hand, in vitro investigation of new antifungal agents or susceptibility tests can employ CFU and XTT assays for planktonic and biofilms cultures, respectively.
In conclusion, our study demonstrated that the quantification methods of C. albicans (cells/mL, CFU/mL, and vPCR) did not agree, regardless of the fungal morphology/growth, even though a significant and strong correlation is observed. Independent of the morphology/growth, the method of CFU/mL underestimated the method of cells/mL, and vPCR overestimated both cells/mL and CFU/mL. However, the methods of cells/mL and CFU/mL are more similar to each other, while vPCR is more different. For biofilms, XTT showed lack of agreement and moderate/weak correlation with the other methods; it was also the most different method in terms of variability, while vPCR was more similar to CFU/mL and cells/mL. Nonetheless, the quantification method should be chosen considering the technical mastery of the team, cost, time, and resources available for the investigation. Our study does not aim to indicate a specific quantification method to be used for a specific situation. However, different quantification methods should not be used for the same assay without the purpose of complementing each other because they can bias the outcomes. Assays should be designed based on the aim of the study and considering the limitations of the quantification methods. Based on the findings of this investigation, new studies can be conducted to improve the existing methods for quantification of C. albicans and other filamentous fungi. Developing a new method that remedies the limitations of the current quantification techniques is a long road that requires time, hard work, and more comprehensive approaches. Nevertheless, this study can be a first step to pave the way for such development.
MATERIALS AND METHODS
Candida albicans strains and culture conditions
A reference strain (SC5314) and two oral isolates (24B1 and 30B1) of C. albicans were used. The clinical strains were isolated from patients with denture stomatitis with and without diabetes and identified in previous studies 29, 30. The three strains were kept at −80°C in Yeast Nitrogen Broth with 100 mM glucose (YNBg, Difco, Detroit, MI, USA) with 50% glycerol. Each strain was individually thawed and plated onto Sabouraud Dextrose Agar (SDA; Acumedia Manufacturers Inc., Lansing, MI, USA) with 0.05 mg/mL chloramphenicol. The plates were incubated at 37°C for 48 h. The planktonic growth for each morphology (yeast and filaments) was controlled by temperature, atmosphere, and culture media, according to the methods described by Merson-Davies & Odds 1989 31 and Mukaremera et al. 2017 32 with some modifications:
Yeast growth
Three to five colonies of each strain were individually transferred to YNBg and incubated at 26°C for 16 h (starter culture). Each fungal suspension was diluted at 1:10 in fresh YNBg and incubated at 26°C until the optical density at 540 nm (OD540) reached the mid-log growth phase previously established for each strain (inoculum, OD540nm = 0.5 ± 0.1 arbitrary units, a.u., which corresponded to 2.92 x 10⁷ ± 1.13 x 10⁷ CFU/mL for SC5314, 6.41 x 10⁷ ± 1.56 x 10⁷ CFU/mL for 24B1, and 1.23 x 10⁶ ± 3.18 x 10⁵ CFU/mL for 30B1).
Filamentous growth
The same starter cultures and inocula were grown as described above and centrifuged at 2688 xg for 5 min at 26°C, washed twice with phosphate-buffered saline (PBS, 0.136 M NaCl, 1 mM KH2PO4, 2 mM KCl, 10 mM Na2HPO4, pH 7.4) and resuspended in bicarbonate free Roswell Park Memorial Institute 1640 medium (RPMI; Sigma-Aldrich, St. Louis, MO), buffered with morpholinepropanesulfonic acid (MOPS; Sigma-Aldrich), and supplemented with 2% D-glucose (Synth, São Paulo, Brazil), pH 7.0 (RPMIg). Then, each fungal suspension was incubated in 5% CO2 at 37 °C for 8 h under 75 rpm for filamentation.
Merson-Davies & Odds 198931 also described the induction of pseudohyphae after fungal starvation in 0.15 M NaCl for 24 h followed by resuspension in RPMIg. However, this protocol also resulted in true hyphae in our study (Figure S3A), confirming that currently, there is no in vitro protocol to grow pseudohyphae 7. Although serum has been considered the “magic potion” for inducing hyphae 33, we observed similar results using the procedure of filamentous growth described above and the addition of 10% serum to RPMIg (Figure S4B and S4C).
Biofilms
Biofilms usually present mixed morphologies of C. albicans, with yeasts and filaments. Starter cultures and inocula were grown, and 1.2 mL aliquots of each fungal suspension were transferred to 48-well, flat-bottom microtiter plates (Kasvi, São José dos Pinhais, Brazil), which were incubated at 90 min at 37°C at 75 rpm (adhesion phase). Then, the wells were washed twice with PBS to remove non-adherent cells, and 1.2 mL of RPMIg was added to each well. The plates were incubated in 5% CO2 at 37°C for 48 h for biofilm formation. After the first 24 h, the medium was renewed by fresh RPMI, and after 48 h, the biofilms were washed twice with PBS, scraped for 30 sec using a pipette tip, and transferred to microtubes (Kasvi).
Quantification Methods
Each fungal growth was submitted to sonication to disaggregate cell clusters before quantification. Even planktonic cultures (yeast and filaments) were submitted to sonication because it was verified that planktonic cells also showed aggregation during their growth 34. Yeast, filaments, and biofilm samples were sonicated for 30, 40, and 60 sec (50, 69, and 84 J), respectively. Then, each suspension was tenfold serially diluted, and each dilution (10-6, 10-5, 10-4, and 10-3) was considered an independent sample. Then, each sample was submitted to the quantification methods of cells/mL (100 μL), CFU/mL (100 μL), vPCR (800 μL), and XTT assay for biofilms (200 μL):
Cells/mL
Samples were stained with 31.2 μg/mL concanavalin A – Alexa Fluor 488 conjugate (Thermo Fisher Scientific, Waltham, MA, USA) to label viable cells (green, excitation/emission of 488/525 – 617 nm) and 20 μM propidium iodide (Sigma-Aldrich) to label non-viable (red, 561/604 – 700 nm) cells for 30 min. Samples were centrifuged (2688 xg for 5 min at 26°C for yeast and 37°C for filaments and biofilms), washed twice with PBS, fixed in paraformaldehyde 4% for 30 min, and incubated with a solution comprised of 10 μL of Hoescht 33342 (Thermo Scientific), 100 μL of Triton-X100 (Sigma-Aldrich), and 900 μL of PBS to label the cells’ nuclei (blue, 405/400 – 475 nm) for 30 min. After incubation, samples were washed and resuspended in PBS, and an aliquot of 10 μL was transferred to a Neubauer chamber (Kasvi) for cell counting in a confocal scanning laser microscope (CSLM, Carl Zeiss LSM 800 with Airyscan, Germany) using 1 μm for z-stack.
CFU/mL
Each sample was submitted to the same labeling steps as described above, but using only PBS without the chromophores to avoid overestimating CFU/mL. Then, each independent sample (already diluted as described above to 10-6, 10-5, 10-4, and 10-3) was tenfold serially diluted, and 10 μL (the same volume used for cells/mL) aliquots were plated on SDA (drop method to avoid cell loss attached to the Drigalski spreader), which was incubated at 37°C for 24 h for colony count.
vPCR
A previous study reported that EMA was more effective than PMA for distinguishing viable and non-viable cells of C. albicans 35. Therefore, the samples were incubated with EMA (E1374, Invitrogen, Thermo Fisher Scientific Inc.) at 50 μM for 30 min in the dark and photoactivated for 15 min (30.15 J/cm2) using a blue LED light (MMOptics, São Carlos, SP, Brazil), with maximum absorption at 455 nm. An autoclaved suspension of C. albicans was also treated with EMA and was used as a control (EMA-control). Then, each sample was centrifuged (2688 xg for 5 min at 26°C for yeast and 37°C for filaments and biofilms), and the genomic DNA was extracted using the EPICENTRE MasterPure™ Yeast DNA Purification Kit (Lucigen Corp., Middleton, WI, USA) following the manufacturer’s recommendations. The DNA quantity and purity were measured by a nanospectrophotometer (DS-11+, Denovix, Wilmington, DE, EUA). The DNA integrity was assessed by agarose gel electrophoreses. For qPCR, we used a primer that spanned the ITS1 region of the rRNA gene of C. albicans (F: CTTGGTCATTTAGAGGAAGTAA, R: GCTGCGTTCTTCATCGATGC) 36. For each sample, 12.5 μL of 2x SYBRGreen (Sigma-Aldrich), 1.25 μL of primer stock at 10 μM (500 nM in the reaction), 10.75 μL of molecular-grade water, and 0.5 μL of undiluted DNA (at the concentration yielded after isolation) was gently mixed and submitted to the following cycle: cycle 1 at 95°C for 10 min (initial denaturation); cycle 2 (repeated 39 times): 94°C for 15 sec (denaturation), 60°C for 30 sec (annealing), and 60°C for 15 sec (polymerization); and Melting Curve at 55°C for 5 sec and 95°C. Considering that one genome copy corresponds to one single mononuclear cell, a standard curve using the DNA of C. albicans at 107 to 102 CFU/mL was prepared and normalized by its genome size (14.6768 Mb) to calculate the number of nuclei in the sample based on the Cq values obtained25, 26 (it was not possible to calculate the number of cells due to the multinuclear feature of filaments). Additionally, data was also normalized by the genome copy number of the ITS1 rRNA gene (55, http://www.candidagenome.org/cgi-bin/locus.pl?dbid=CAL0000186611). Figure S5 depicts an amplification plot of samples, including EMA-control, and a standard curve obtained after a qPCR cycle.
XTT assay (only for biofilms)
Each sample (200 μL) was mixed with the same volume of a solution of XTT, which consisted of 40 μL of 1 mg/mL XTT {2,3-bis (2-methoxy-4-nitro-5-sulfophenyl)-5-[(phenylamino)carbonyl]-2H-tetrazolium hydroxide, Sigma-Aldrich}, 2 μL of menadione (0.4 mM in acetone), and 158 μL of PBS with 200 mM of glucose. Samples were incubated for 3 h, and absorbance was read at 492 nm.
Antifungal Treatments
The quantification methods were also compared for samples of C. albicans SC5314 submitted to sub-lethal doses of antifungal treatments (antifungal agent and antimicrobial Photodynamic Therapy, aPDT). Fluconazole (FCZ, Sigma-Aldrich) was chosen as an antifungal agent due to its fungistatic activity (a previous study demonstrated that a fungicide agent, amphotericin B, was not able to demonstrate underestimation of C. albicans by the XTT method compared to qPCR 23). We used FCZ at 1 μg/mL prepared in 2.5% dimetilsulfoxide (DMSO) as previously described 37 and incubated with the samples for 24 h. Although our previous study 37 found that the MIC of FCZ was 0.5 μg/mL for C. albicans at 103 CFU/mL, we used here a higher antifungal concentration (1 μg/mL) because FCZ at the MIC did not inhibit the growth of C. albicans at 106 CFU/mL.
For aPDT, curcumin (Sigma-Aldrich) was used as photosensitizer at 0.5 μM for planktonic samples (yeast and filaments) and 1 μM for biofilms, prepared in DMSO 2.5% and incubated with the samples for 5 min (planktonic cultures) or 10 min (biofilms) in the dark (pre-irradiation time). The blue (~455 nm) LED light (47 mW/cm2, MMOptics, São Carlos, SP, Brazil) was used to irradiate the samples at 3.62 (yeast and filaments) or 5 J/cm2 (biofilms).
After antifungal treatments (FCZ and aPDT), samples were submitted to the same quantification methods described above.
Statistical Analyses
Four cultures were performed, and each culture resulted in four samples (n = 16) for each morphology/growth (yeast, filament, biofilm) of each strain (SC5314, 30B1, 24B1) and treatment (aPDT and FCZ). All data was pooled within each morphology/growth for analyses (n = 48-106) disregarding strains and treatments to meet the assumption of normality and reach a higher sample size for a satisfactory statistical analyses. Analyses were performed using log10-transformed data to plot all the data ranges. Data were checked for outliers (Tukey method) and normal distribution (skewness and kurtosis coefficients). Agreement was evaluated using the Concordance Correlation Coefficient (CCC) 38, the Intraclass Correlation Coefficient (ICC, absolute agreement) 39, and the Bland-Altman Plot 40. Considering that the absorbance values of XTT have a different unit magnitude from the other quantification methods, data from all the methods (cells/mL, CFU/mL, vPCR, and XTT) obtained for biofilms were transformed (normalized by their respective maximum value) in order to perform the agreement analyses. CCC and ICC values were interpreted according to McBride41 and Fermanian42 criteria. Statistical analyses were performed with MedCalc Statistical Software version 13.2.0 (MedCalc Software Lta., Ostend, Belgium). Data from the quantification methods were submitted to the Pearson Correlation test and the assumptions of independence of residual (Durbin-Watson value between 1.5 and 2.5), linearity, and homocedasticity (residual-versus-predicted plots with dots symmetrically surrounding the zero line without a bowed pattern or any non-retangular shape) of linear regression. Finally, to visualize the similarities and differences among the quantification methods, Principal Component Analysis (PCA) was performed for all morphologies/growths and only for biofilms to include the XTT assay. The oblique Oblimin rotation with Kaiser normalization was used to determine on which component each variable loaded highly. The level of significance was 5%.
SUPPLEMENTAL INFORMATION
 Download Supplemental Information
AUTHOR CONTRIBUTIONS
Conceptualization, EGOM; Microbiological assays, ABS, MCA, LRM, EGOM; Molecular Biological Assays: MCA, LRM, MIK, EGOM; Microbial Labeling, Confocal Settings, and Image Acquisition: ASB, MCA, LRM, PAB, EGOM; Data analyses: LND, EGOM; Supervision: EGOM; Draft Writing: ASB, EGOM; Review and final writing: ASB, MCA, LRM, MIK, ACP, PAB, LND, and EGOM; resources and funding: EGOM.
ACKNOWLEDGMENTS
This study was supported by the São Paulo Research Foundation (FAPESP grants 2018/02513-9, 2017/24591-9, 2021/08890-1, and RIDC 13/07276-1). Author ABS received a master’s scholarship from the National Council for Scientific and Technological Development (CNPq). Authors report no conflict of interest.
COPYRIGHT
© 2024

Quantification methods of Candida albicans are independent irrespective of fungal morphology by Soares et al. is licensed under a Creative Commons Attribution 4.0 International License.