Research Articles:
Microbial Cell, Vol. 11, No. 1, pp. 353 - 367; doi: 10.15698/mic2024.10.838
A complex remodeling of cellular homeostasis distinguishes RSV/SARS-CoV-2 co-infected A549-hACE2 expressing cell lines
1 Department of Biomedical and Clinical Sciences, University of Milan, Milan, Italy. 2 Department of Pathophysiology and Transplantation, University of Milan, Milan, Italy. 3 Department of Biomedical and Clinical Sciences, Fondazione Don Carlo Gnocchi, IRCCS, Milan, Italy.
Keywords: Respiratory Syncytial Virus (RSV), SARS-CoV-2, co-infection, cellular homeostasis, autophagy.
Received originally: 05/06/2024 Received in revised form: 17/09/2024
Accepted: 24/09/2024
Published: 08/10/2024
Correspondence:
Mara Biasin, Prof, Department of Biomedical and Clinical Sciences, University of Milan, via G.B. Grassi 74, 20157, Milan, Italy; Telephone number: +39 02503 19679; mara.biasin@unimi.it
Conflict of interest statement: The authors declare that they have no competing interests.
Please cite this article as: Claudia Vanetti, Irma Saulle, Valentina Artusa, Claudia Moscheni, Gioia Cappelletti, Silvia Zecchini, Sergio Strizzi, Micaela Garziano, Claudio Fenizia, Antonella Tosoni, Martina Broggiato, Pasquale Ogno, Manuela Nebuloni, Mario Clerici, Daria Trabattoni, Fiona Limanaqi, Mara Biasin (2024). A complex remodeling of cellular homeostasis distinguishes RSV/SARS-CoV-2 co-infected A549-hACE2 expressing cell lines. Microbial Cell 11: 353-367. doi: 10.15698/mic2024.10.838
Abstract
Concurrent infections with two or more pathogens with analogous tropism, such as RSV and SARS-CoV-2, may antagonize or facilitate each other, modulating disease outcome. Clinically, discrepancies in the severity of symptoms have been reported in children with RSV/SARS-CoV-2 co-infection. Herein, we propose an in vitro co-infection model to assess how RSV/SARS-CoV-2 co- infection alters cellular homeostasis. To this end, A549-hACE2 expressing cells were either infected with RSV or SARS-CoV-2 alone or co-infected with both viruses. Viral replication was assessed at 72 hours post infection by droplet digital PCR, immunofluorescence, and transmission electron microscopy. Anti-viral/receptor/autophagy gene expression was evaluated by RT-qPCR and confirmed by secretome analyses and intracellular protein production. RSV/SARS- CoV-2 co-infection in A549-hACE2 cells was characterized by: 1) an increase in the replication rate of RSV compared to single infection; 2) an increase in one of the RSV host receptors, ICAM1; 3) an upregulation in the expression/secretion of pro-inflammatory genes; 4) a rise in the number and length of cellular conduits; and 5) augmented autophagosomes formation and/or alteration of the autophagy pathway. These findings suggest that RSV/SARS-CoV-2 co-infection model displays a unique and specific viral and molecular fingerprint and shed light on the viral dynamics during viral infection pathogenesis. This in vitro co-infection model may represent a potential attractive cost-effective approach to mimic both viral dynamics and host cellular responses, providing in future readily measurable targets predictive of co-infection progression.
INTRODUCTION
Co-infections by more than one virus sharing the same tropism account for about the 10–30% of all respiratory viral infections, and children turn out to be mostly affected by such co-infections 1, 2. Available data on the clinical impact of co-occurring viruses in the respiratory tract are controversial: while some studies report null or reduced pathogenicity after the co-infection 3, 4, 5, others indicate the occurrence of worrisome detrimental consequences 6. This discrepancy has created an urgent need to investigate the impact of viral co-infections on host susceptibility, virus transmission and virulence. Experimental approaches can provide insight into how intrinsic and extrinsic factors can influence virus-virus interactions and help to decipher the cellular and molecular mechanisms underpinning the outcome of co-infections. Indeed, viral co-infections often trigger different cellular pathways, alter viral pathogenicity and disease outcomes, resulting in variable clinical symptoms that makes difficult to accurately handle disease progression.
RSV and SARS-CoV-2 are two common co-circulating viruses of clinical significance that share the same tropism. SARS‐CoV‐2 main target is the upper respiratory tract and infection can frequently lead to pneumonia 7, 8. Virus cell tropism and pathogenicity are determined by the Spike protein, which engages the host cell receptors, mainly ACE2, through its receptor-binding domain (RBD). Indeed, ACE2 expression is the main driver of the SARS-CoV-2 infection gradient. Thus, nasal ciliated cells as well as upper bronchial epithelia which express high ACE-2 levels are the primary target for SARS-CoV-2 replication in the early stages of infection 9, 10, while in the lower lung infection is restricted to alveolar type II cells 11. Recently CD147, a transmembrane glycoprotein expressed ubiquitously in epithelial and immune cells, was proposed as an alternative receptor for SARS-CoV-2 infection 12, 13, albeit its role has been largely discussed 14, 15. RSV is the leading cause of acute lower respiratory tract infection in children under five years of age 16, 17, 18. Despite numerous host receptors having been identified 19, RSV tropism is highly limited to the respiratory tract, namely the type I alveolar pneumocytes and the apical surface of ciliated airway epithelial cells 20. Following a transient period of replication in the epithelium of the nasopharynx and upper respiratory tract, RSV infection can spread to the small bronchioles or alveoli of the lower respiratory tract, where the host immune response causes airway narrowing, resulting in bronchiolitis mostly in young children and acute respiratory illness in older adults 21, 22.
SARS-CoV-2/RSV co-infection can lead to serious clinical outcomes, exacerbating the activation of inflammatory responses that might result in lung damage 23, 24. However, to date, the dynamics of SARS-CoV-2/RSV co-infection are unclear.
There is an unmet need for preclinical models to understand the pathogenesis of human respiratory viruses. Most of our knowledge derives from clinical observations and single-infection studies. Unfortunately, determining the consequences of co-infection through observation of natural infections in humans is reductive. While these studies provide a phenotypical description of disease, the cellular and molecular events resulting from the co-presence of two or more viruses are not well understood. Direct interactions between viruses in the same tissue or even within co-infected cells can result in a plethora of phenomena, including impaired immune responses 25, altered cellular activity 25, and changes in viral progeny, such as pseudotyping 26, 27, 28 or genomic rearrangements 26. Few in vivo 29, 30, 31, 32, 33 and in vitro 28, 34, 35 models have been proposed to study respiratory viral co-infections. One method that is commonly used as a measure of viral fitness is an in vitro viral competition assay. This type of assay is accomplished by competition experiments, in which cells are infected with two or more viral isolates 36, 37.
Given the common tropism of SARS-CoV-2 and RSV, and the unclear consequences of their mutual influence, we developed an in vitro lung epithelial cell model to study the molecular mechanisms and cellular pathways modulated in viral co-infection.
–
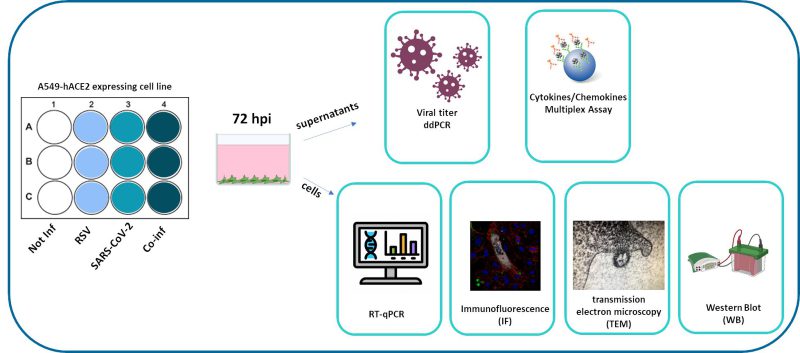 |
FIGURE 1: Synoptic representation of the study design. |
RESULTS
Viral replication during RSV and SARS-CoV-2 co-infection of A549-hACE2 lung cell lines
We compared viral replication dynamics of each virus in both RSV and SARS-CoV-2 single infection and in the co-infection model, at equivalent MOI (mulitplicity of infection; Fig. 1). First, we followed single and co-infection viral replication trend up to one week. We decided to perform all the following analyses at 72 hours post infection (hpi) because at this stage, RSV infection/replication, in the presence of SARS-CoV-2, is significantly enhanced compared to the single infection, a scenario that is not appreciable after 72 hpi. We therefore assumed that potential variances in the expression of the molecular determinants responsible for the different viral replication could be more appreciable at this time point (Supplementary Figure S1A). Indeed, a significant increment in RSV replication was observed in co-infected cells compared to single RSV-infection (p<0.01) (Fig. 2A). Conversely, SARS-CoV-2 replication was unaffected when co-cultured together with RSV (Fig. 2A). These results were confirmed by IF (immunofluorescence) analysis, performed by double immunolabelling for RSV and SARS-CoV-2 proteins. Interestingly, while SARS-CoV-2 staining showed the same pattern in the single infection and in the co-infected condition, the RSV signal was significantly increased in co-infection compared to RSV single infection (Fig. 2B), suggesting that RSV may take advantage of SARS-CoV-2 infection for host cell invasion. To assess the co-infection on another respiratory cell line, we single infected and co-infected Calu-3 cells (human bronchial epithelial cells generated from an adenocarcinoma), following the same experimental set-up (Fig. 1). Results herein show that the trend of viral replications was superimposable to that observed in A549-ACE2 cell line as shown in Supplementary Figure S1B, despite occurring at earlier stage of infection compared to A549-hACE2, a difference that could be attributed to the distinctive characteristics of the cell lines.
–
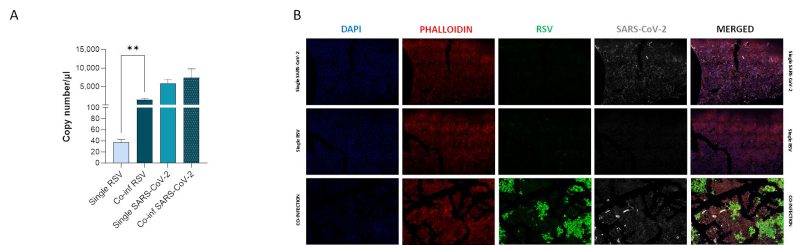 |
FIGURE 2: Assessment of in vitro RSV and SARS-CoV-2 viral replication. (A) SARS-CoV-2 and RSV viral replication was assessed by digital droplet PCR in single infection and co-infection conditions at 72 hpi. Significant differences between groups are indicated by * (Unpaired t test). Mean values ± SEM are reported. **p<0.01. (B) Representative immunofluorescence images acquired in 40X resolution of combined F-RSV and N-SARS-CoV-2 proteins 48 hpi in uninfected, SARS-CoV-2 single-infected, RSV single-infected and co-infected A549-hACE2 cells (DAPI in blue, phalloidin in red, N-SARS-CoV-2 in grey, F-RSV in green). |
Single cell co-infection
A central question is whether two or more viruses can simultaneously infect a single cell and how co-infection alters cellular homeostasis. IF images (Fig. 3A) show what happens in a cell infected by both SARS-CoV-2 and RSV. Notably each virus occupies a specific area within the cellular environment: the perinuclear region for SARS-CoV-2 and a more peripheral zone for RSV.
TEM (transmission electron microscopy) analysis confirmed that these infections are productive, as mature RSV and SARS-CoV-2 virions were observed in single cells (Fig. 3A and B). Specifically, within the same cell, SARS-CoV-2 assembled virions are compartmentalized into vesicles (Fig. 3b and c), whereas RSV most of the time is observed as budding from the surface of the same infected cell (Fig. 3b–d).
–
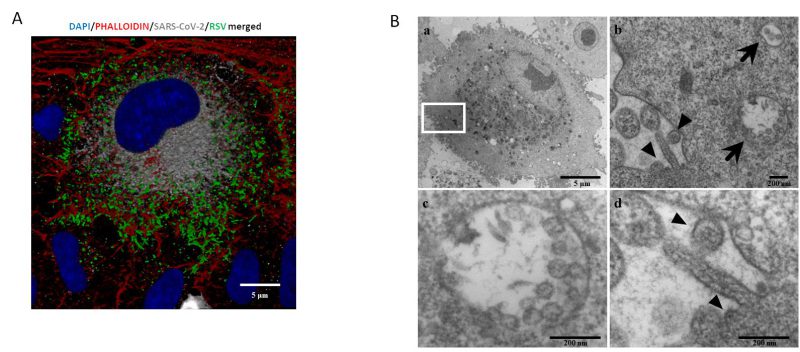 |
FIGURE 3: Single cell in vitroco-infection assessment. (A) Representative IF image of combined RSV-F and SARS-CoV-2-N proteins 48 hpi in a co- infected A549-hACE2 cell (DAPI in blue, phalloidin in red, N-SARS-CoV-2 in grey, F-RSV in green). Bars correspond to 5 µm. (B) a. Representative electron microscopy image of a A549 cell co-infected with SARS-CoV-2 and RSV at 72 hpi. Scale bar= 5 µm; b. A greater enlargement of the outlined area of the fig. (a) showing the morphological features of the co-infection with SARS-CoV-2 (arrows) and RSV (arrowheads). Scale bar= 200 nm; c. High magnification of a vesicle containing multiple SARS-CoV-2 assembled virions (average diameter ≈80 nm). Within virions, the nucleocapsid is visible as small electron-dense dots. Scale bar=200 nm; d. Higher magnification of RSV virion (arrowheads) budding from the surface of the infected cell, showing a spherical and the nucleocapsid which appears as electron-dense dots. Scale bar= 200 nm. |
RSV and SARS-CoV-2 host-receptor analyses
Probing into the mechanisms responsible for the increased RSV replication in the presence of SARS-CoV-2, we sought to determine whether co-infection modulates the expression of viral receptors on the surface of cells (Fig. 4). Among the numerous host molecules identified to be exploited by RSV for cell entry 19 including the CX3C chemokine receptor 1 (CX3CR1), insulin-like growth factor-1 (IGF-1R), heparan sulfate proteoglycan 2 (HSPG2), epidermal growth factor (EGFR), nucleolin (NCL), and intercellular adhesion molecule-1 (ICAM1), the expression of ICAM1 alone was modified in co-infected cells. Indeed, a significant increase in ICAM1 expression was observed in the co-infected cells compared to the uninfected controls (p<0.001) and to the RSV (p<0.01) single infection (Fig. 4A). As for the host human receptors exploited by SARS-CoV-2, neither ACE2 nor CD147 expression was significantly altered by co-infection (Fig. 4B). Likewise, the expression of the TMPRSS2 protease was unchanged, while a significant increase in furin expression was observed in co-infected compared to control cells (p<0.05) (Fig. 4B). To track the dynamics of the infections over time, we investigate the expression of ICAM1 at 3, 24, 48 and 72 hpi. We observed that, while ICAM1 was highly expressed in the RSV single infection condition at 3 hpi, its expression dropped at 24 hpi and did not recovered over time. Conversely, in SARS-CoV-2 single and in co-infected condition ICAM1 expression was boosted at 48 and 72 hpi in parallel with the increased RSV replication (Fig. 4C).
–
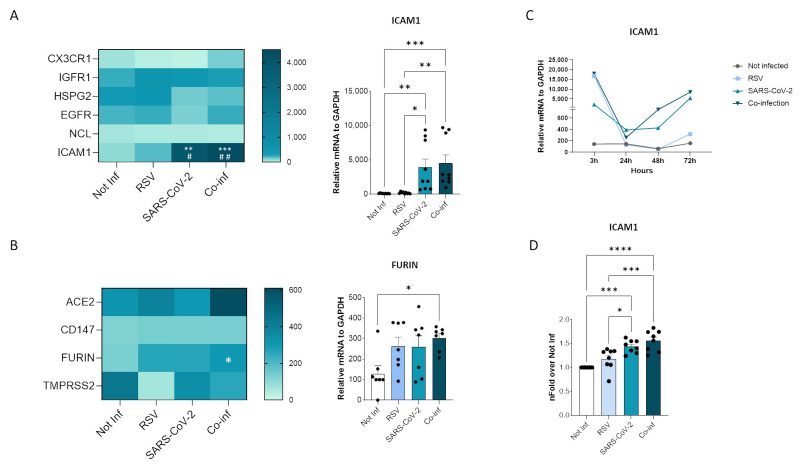 |
FIGURE 4: Viral receptor expression analyses. Heatmaps representing mRNA expression of RSV (A) and SARS-CoV-2 (B) receptor mRNA expression. Significant differences between groups are indicated by * (vs Not-inf), # (vs RSV) and §(vs SARS-CoV-2) (ANOVA post hoc Tukey test, p values adjusted for multiple comparisons). Mean values are reported. * p < 0.05, **p<0.01, ***p<0.001, ****p<0.0001; those displaying significantly different results have been reported as mean ± SEM histograms from at least n = 3 independent experiments. (C) Time course of ICAM1 mRNA expression. (D) Flow cytometric evaluation of ICAM1 expression on uninfected, RSV single infected, SARS-CoV-2 single infected and co-infected A549-hACE2 cell membranes at 72 hpi. Results (from at least n = 3 independent experiments) are presented as mean ± SEM of n-fold over not-infected condition (Not-inf). Significant differences between groups are indicated by * (ANOVA post hoc Tukey test, p values adjusted for multiple comparisons). * p < 0.05, ***p<0.001, ****p<0.0001. |
The transcriptional increase in ICAM1 expression was mirrored by an augmented surface protein expression in co-infection compared to all the other conditions, as demonstrated by flow cytometric analysis (co-infection versus not-infected control: p<0.0001; co-infection versus RSV single-infected: p<0.001) (Fig. 4D).
The trend of ICAM-1 expression in single and co-infected Calu-3 cell line mirrored that observed in A549-hACE2 cell line (Supplementary Fig. S2A).
In the RSV/SARS-CoV-2 co-infection there is an increase in cellular conduit formation
RSV infection was found to stimulate the formation of filopodia 38, which are long slender projections originating from the cell surface. Changes in epithelial cell morphology upon single RSV and SARS-CoV-2 infections and co-infection were investigated by IF analysis.
Substantial morphological changes characterized co-infected cells. As shown in Fig. 5, RSV/SARS-CoV-2 co-infection increased the number and length of cellular conduits, traceable to filopodia-like structures, compared to the uninfected control and to the single RSV infection. Even more relevant, in the co-infection condition RSV tends to localize within these cytoplasmatic protrusions, which notoriously ease the infectious process 38, 39.
–
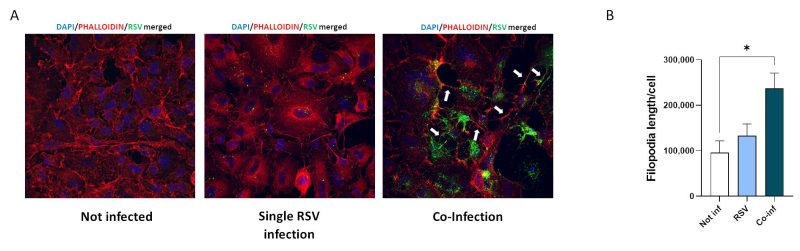 |
FIGURE 5: Analyses of viral-driven conduits by IF. (A) Representative immunofluorescence images acquired in 40X resolution of F-RSV protein 48 hpi in uninfected, RSV single-infected and co-infected A549-hACE2 cells (DAPI in blue, phalloidin in red, F-RSV in green). White arrows show viral-driven conduits. (B) Quantification of filopodia length per cell in not infected, RSV single infected (RSV) and co-infected (Co-Inf) conditions. Significant differences between groups are indicated by * (ANOVA post hoc Tukey test, p values adjusted for multiple comparisons). Results are presented as mean ± SEM. * p< 0.05. |
mRNA expression analyses of several host determinants involved in viral infections
To investigate the molecular profile associated with the RSV+SARS-CoV-2 co-infection, we performed a transcriptional analysis of genes implicated in anti-viral response (MXA, MX2, IFNA, IFNB, INFG, ACE2, IFITM1, IFITM3), signaling cascade (IFI16, NF-κB, STAT1, STAT3) and genes involved in the antigen processing and presentation pathway (ERAP1, ERAP2, TAP1 and HLA-A). SARS-CoV-2 infected cells were characterized by a more pronounced activation profile (SARS-CoV-2 vs. uninfected control: MX2 p<0.01, IFIM1 p<0.001, NFkB p<0.0001, IFI16 p<0.05, ERAP2 p<0.05, TAP1 p<0.05, HLA-A p<0.05; SARS-CoV-2 vs. RSV: IFITM1 p<0.001, NF-κB p<0.0001, IFI16 p<0.05, ERAP2 p<0.05, TAP1 p<0.05, HLA-A p<0.05) compared to those infected with RSV only; this might depend on the greater in vitro infectious efficacy shown by SARS-CoV-2. Co-infection resulted in a significant increase of all the antiviral and signal cascade genes (co-infection vs. uninfected control: MXA p<0.0001, MX2 p<0.0001, IFITM1 p<0.0001, IFITM3 p<0.01, NFkB p<0.0001, IFI16 p<0.0001, IFNB p<0.01; co-infection vs. RSV: MXA p<0.0001, MX2 p<0.0001, IFITM1 p<0.0001, IFITM3 p<0.01, NF-κB p<0.0001, IFI16 p<0.0001, IFNB p<0.01; co-infection vs. SARS-CoV-2: MXA p<0.01, MX2 p<0.0001, IFITM1 p<0.01, IFI16 p<0.001) and of ERAP2, TAP1 and HLA-A (co-infection vs. uninfected control: TAP1 p<0.05, HLA-A p<0.001; co-infection vs. RSV: ERAP2 p<0.05, TAP1 p<0.05, HLA-A p<0.001) (Fig. 6).
–
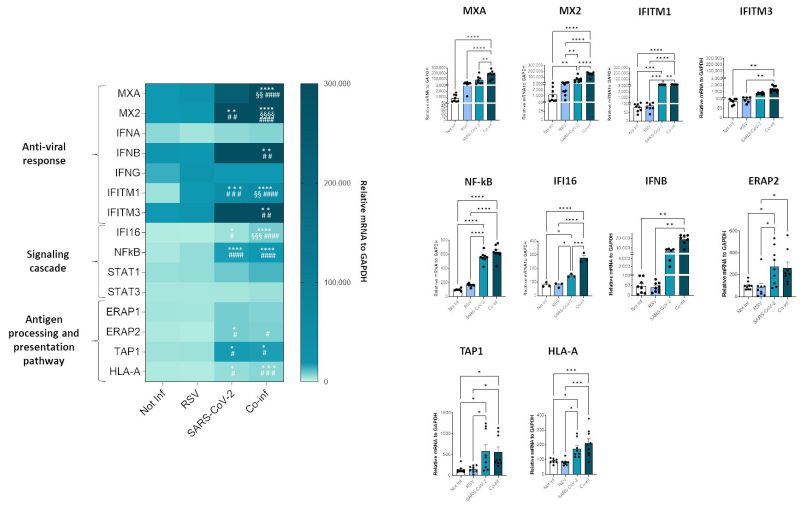 |
FIGURE 6: Analyses of A549-hACE2 cell line transcriptome following single SARS-CoV-2, RSV infection or co-infection. Antiviral, inflammatory, antigen presentation gene expression was assessed by real-time PCR. Results are summarized in a heatmap; those displaying significantly different results have been reported as mean ± SEM histograms from at least n = 3 independent experiments and significant differences between groups are indicated by * (ANOVA post hoc Tukey test, p values adjusted for multiple comparisons), * p < 0.05, **p<0.01, ***p<0.001, ****p<0.0001. |
Notably, the same trend was observed in Calu-3 infected cell lines as assessed by IL-6 mRNA analyses (Supplementary Figure S2B).
Cytokine profiling of single and co-infected cell cultures
Next, we evaluated the mRNA expression of molecules involved in the inflammatory response (e.g. IL-1B, IL-6, IL-17A, IL-18, CASP1, CASP3, CASP8), as depicted in Figure 7A. The results corroborate the presence of a pronounced inflammatory profile in the co-infected condition (co-infection vs. uninfected control: IL-1B p<0.01, IL-6 p<0.001, IL-17A p<0.01, CASP1 p<0.01; co-infection vs. RSV: IL-1B p<0.0001, IL-6 p<0.01, IL-17A p<0.01, CASP1 p<0.001; co-infection vs. SARS-CoV-2: IL-17A p<0.01), remarkably higher to that observed in the infection with single viruses only. For instance, CASP1 was the only gene that exhibited a modulation by SARS-CoV-2 compared to the uninfected control (p<0.01).
In the attempt to further dissect the inflammatory profile emerged in the transcriptome analysis, the secretome of both single infections was compared to that of the co-infected condition (Fig.7B). After 72 hours of infection the concentration of the majority of analyzed cytokines (IL-1β, IL-2, IL-4, IL-5, IL-6, IL-8, IL-17, G-CSF, GM-CSF, IFN-γ, MIP-1β, TNF-α) was significantly increased in both single and double-infected cells (Fig. 7B). Notably, the concentration of all analyzed cytokines was significantly increased when co-infected cells were compared to the uninfected control (IL-1β p<0.0001, IL-2 p<0.0001, IL-4 p<0.0001, IL-5 p<0.0001, IL-6 p<0.01, IL-8 p<0.0001, IL-17 p<0.0001, G-CSF p<0.01, GM-CSF p<0.01, IFN-γ p<0.0001, MIP-1β p<0.0001, TNF-α p<0.0001) and to cells infected by either RSV (IL-1β p<0.0001, IL-2 p<0.0001, IL-4 p<0.0001, IL-5 p<0.0001, IL-6 p<0.01, IL-8 p<0.0001, IL-17 p<0.0001, G-CSF p<0.01, GM-CSF p<0.01, IFN-γ p<0.0001, MIP-1β p<0.0001, TNF-α p<0.0001) or SARS-CoV-2 (IL-1β p<0.05, IL-2 p<0.01, IL-4 p<0.05, IL-5 p<0.05, IL-6 p<0.05, IL-8 p<0.05, GM-CSF p<0.01, IFN-γ p<0.05, MIP-1β p<0.01, TNF-α p<0.001) alone, confirming the results obtained by gene expression analysis. Again, considering single-infected cells only, SARS-CoV-2 infected cells were characterized by a more pronounced pro-inflammatory profile compared to those infected with RSV (SARS-CoV-2 vs. uninfected control: IL-1β p<0.05, IL-4 p<0.05, IL-5 p<0.01, IL-8 p<0.0001, IL-17 p<0.05, IFN-γ p<0.01; SARS-CoV-2 vs. RSV: IL-4 p<0.05, IL-5 p<0.01, IL-8 p<0.001, IL-17 p<0.05).
–
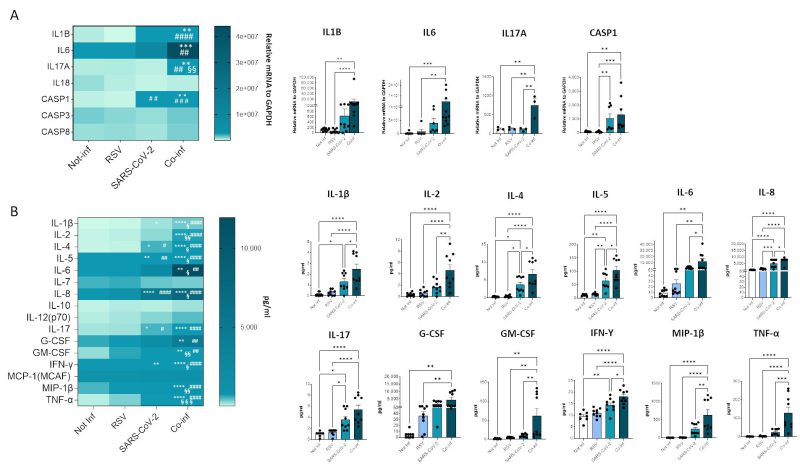 |
FIGURE 7: Cytokine gene expression and secretion from uninfected, RSV, SARS-CoV-2 single-infected and co-infected A549-hACE2 cell lines. (A) The expression of the main cytokines was assessed by real-time PCR and results are summarized in a heatmap. Significant differences between groups are indicated by * (vs Not-inf), # (vs RSV) and §(vs SARS-CoV-2) (ANOVA post hoc Tukey test, p values adjusted for multiple comparisons). Mean values are reported. * p < 0.05, **p<0.01, ***p<0.001, ****p<0.0001. (B) 17-cytokine/chemokine secretion was assessed by multiplex ELISA in supernatants from A549-hACE2 cell lines 72 hpi; results are summarized in a heatmap. Significant differences between groups are indicated by * (vs Not-inf), # (vs RSV) and § (vs SARS-CoV-2) (ANOVA post hoc Tukey test, p values adjusted for multiple comparisons). Mean values are reported. * p < 0.05, **p<0.01, ***p<0.001, ****p<0.0001. Those displaying significantly different results have been reported as mean ± SEM in histograms from at least n = 3 independent experiments (C) and significant differences between groups are indicated by * (ANOVA post hoc Tukey test, p values adjusted for multiple comparisons), * p < 0.05, **p<0.01, ***p<0.001, ****p<0.0001. |
Autophagy is induced in the co-infected condition
Another cellular mechanism exploited to hinder viral infection is autophagy. We thus investigated the expression of the pivotal mediators of autophagy (Fig. 8A).
–
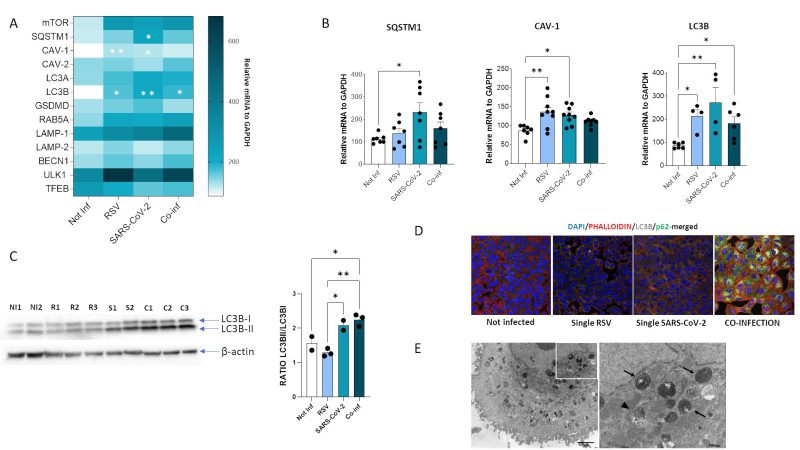 |
FIGURE 8: Assessment of autophagy process in A549-hACE2 cell lines following RSV, SARS-CoV-2 single infection or co-infection. (A) Heatmap representing mRNA expression of autophagy mediators and (B) significantly expressed autophagy mediators. Results are reported as mean ± SEM from at least n = 3 independent experiments, and significant differences between groups are indicated by * (ANOVA post hoc Tukey test, p values adjusted for multiple comparisons), * p < 0.05, **p<0.01. (C) Western blot analysis of LC3B-I and LC3B-II isoforms in uninfected, RSV, SARS-CoV-2 single infected and co-infected conditions and results reported as mean ± SEM histograms. Significant differences between groups are indicated by * (ANOVA post hoc Tukey test, p values adjusted for multiple comparisons). * p < 0.05, **p<0.01. (D) Immunofluorescent staining showing LC3B (grey) and p62 (green) in uninfected, RSV single infected, SARS-CoV-2 single infected and co-infected conditions. (E) Left panel, representative electron microscopy image of a A549-hACE2 cell coinfected with SARS CoV-2 and RSV at 72 hpi with a large amount of widespread autophagosomes at different steps of the autophagic process (early/initial and late autophagic compartments). Scale bar= 2 µm; right panel, a greater enlargement of the outlined area of the fig. (a) showing an early/initial autophagic vacuole (arrowhead) and late autophagic compartments (arrow). Scale bar= 500 nm. |
Results showed that mRNA expression of several of such mediators was increased both in single (SARS-CoV-2 vs. uninfected control: SQSTM1, p<0.05; CAV-1, p<0.05; LC3B, p<0.01) (RSV vs. uninfected control: CAV-1, p<0.01; LC3B, p<0.05) and in co-infected cells (vs. uninfected control: LC3B, p<0.05) (Fig. 8B), but no statistically significant differences were observed at mRNA level by comparing single and combined infections. To verify if the autophagy pathway is far more affected in the co-infection model compared to the single ones, we than performed other assays. First, we evaluated the LC3-II/LC3B-I ratio by Western blot assay. Results demonstrated that co-infection and SARS-CoV-2 single infection significantly increased LC3II/I ratio compared to single RSV infection and uninfected control, suggesting increased availability of the lipidated LC3 isoform for autophagosome formation (co-infection vs. uninfected control: p<0.05; co-infection vs. RSV: p<0.01; SARS-CoV-2 vs. RSV: p<0.05) (Fig. 8C). However, as shown in Figure 8D, this was not parallelled by a decrease in p62 levels, as expected in a functional autophagy flux. Indeed, LC3B and p62 distribution seems to be diffused within the cytoplasm in uninfected control and in RSV-infected cells, whereas LC3B is present as punctate staining co-localizing with p62 in co-infected cells, suggesting accumulation of engulfed autophagosomes in this model. This block in autophagy pathway was further confirmed by TEM analysis (Fig. 8E), displaying a co-infected cell enriched in early and late stage autophagosomes.
DISCUSSION
Cellular interactions among different viruses profoundly influence virus life cycle and transmission as well as host response. Nevertheless, studies characterizing viral co-infection dynamics are rarely performed, and most of our knowledge about the biology and pathogenesis of virus-virus interactions is based on reductionist research approaches. Respiratory viruses share a common tropism for the human respiratory tract and cause significant disease burden. Previous works provided evidence that co-infections with more than one respiratory virus occur and have quantifiable outcomes at multiple levels 40, 41, 42. Herein, we report previously unknown evidence obtained by analyzing cell co-infection with SARS-CoV-2 and RSV, two clinically relevant respiratory viruses that belong to different taxonomical families.
Exploring viral interaction dynamics, the first observation is that the two viruses can influence each other by interfering with the replication rate relative to single infections. Specifically, our results show a substantial increase in RSV infection rate in co-infected cells compared to the individual RSV infection. Our findings are consistent with those observed in a simultaneous RSV/SARS-CoV-2 co-infection in an in vivo model 43. However, contrasting results have been reported in the literature regarding SARS-CoV-2 and RSV replication interference in vitro. A previous study on SARS-CoV-2/influenza A virus (IAV) and SARS-CoV-2/RSV co-infections in which a different in vitro model has been used (air-liquid interface – ALI- cultures of nasal cells) found that RSV replication was significantly affected by coinfection with SARS-CoV-2 44. Conversely, another study focusing on co-infections with the same viruses but using ALI cultures with a different cell type (human bronchial epithelial cells – HBECs) shows that SARS-CoV-2 replication is inhibited in the presence of the other viruses, with IAV being more efficient 45. Finally, in contrast with our results, other studies show RSV replication being reduced in co-infections with other viruses, such as IAV 28. This latter apparent conflicting result likely depends on the different viruses involved, which might trigger diverse virus-specific cellular responses, leading to different outcomes. Other factors, such as virus-specific reduction of viable cells due to virus-induced cell death might also contribute to the interfering phenotype.
We next wondered about co-infection-induced specific cellular mechanisms that could sustain the upregulation of RSV replication in the presence of SARS-CoV-2; several plausible explanations emerged. Firstly, co-infection is characterized by a generalized activation profile, as documented by transcriptome and secretome analyses. Indeed, determinants involved in the antiviral immune responses, including most of the IFN-stimulated genes (ISGs) and pro-inflammatory factors are significantly increased in co-infected cells, possibly justifying the noticeable clinical severity of RSV/SARS-CoV-2 co-infection 24. It has been reported that different viruses are able to induce ISGs and antiviral responses to different extents, thus influencing virus-virus dynamics during viral co-infections. It is possible that the degree of interference depends, for example, on the potency of the IFN response induced by one virus and the susceptibility of the other virus to the IFN response. Evidence from other in vitro studies suggests that virus-induced IFN-mediated interference is a major contributor to negative interactions within the host and is virus specific. For example, IAV appears to be a more potent blocker of SARS-CoV-2 than RSV 45 because IAV is apparently a much more efficient inducer of IFNs 46. Of note, genes encoding for molecules involved in the antigen presentation process, namely ERAP2 and TAP1, were significantly upregulated as well following SARS-CoV-2 infection and co-infection, as reported by other authors 47, 48. Whether this boost in the expression of genes related to the antigen presentation machinery might result in an increased activation of CD8 T lymphocytes-mediated immune response needs to be addressed in future analyses.
Another plausible explanation for the observed upregulation of RSV replication in the co-infection setting could be ascribed to a peculiar modulation of the host receptors responsible for viral entry. RSV can bind CX3CR1 49, 50, 51, 52 and HSPG2 53, 54 via the G protein, as well as to NCL 55, 56, IGF-1R 57, EGFR 58, and ICAM1 59, a primary receptor for the major groups of rhinoviruses 60, via the F protein 61. Among the aforementioned RSV receptors, ICAM1 is the most intriguing. Of note, its expression is significantly increased following SARS-CoV-2 infection and this in turn could facilitate RSV entry and replication in the co-infection state. This observation is reinforced by clinical results suggesting that in the serum of convalescent patients, ICAM1 concentration peaks weeks after COVID-19 diagnosis 62. Thus, it is tempting to speculate that RSV takes advantage of SARS-CoV-2-induced expression of ICAM1, which may be crucial for the increment in RSV entry/replication rate at later time points, as confirmed by time course analyses. As for HSPG2, though not being statistically significant, it showed a diminished trend of expression following SARS-CoV-2 and co-infection which is in line with a recent publication by Pawlica et al. 63. Indeed, the authors reported that SARS-CoV-2 expresses a microRNA-like small RNA, CoV2-miR-O7a, capable of selectively silencing host genes, including HSPG2, so as to evade the host IFN response and perhaps inhibit viral superinfection.
Another mechanism responsible for increased RSV replication rates may rely on the production of filamentous projections. RSV infection triggers the formation of slender actin-rich cell protrusions, called filopodia, by inducing actin polymerization on the infected lung epithelial A549 cells 38, 64, 65. Similarly, there is evidence that SARS-CoV-2 induces the development of so-called long tunneling nanotubes that connect host cells 66, 67. Our results show that co-infected cells are characterized by a markedly enhanced formation of filamentous projections connecting cells, which could favor viral infection, replication, and cell-to-cell spread. Indeed, these cellular protrusions are known to enhance viral infectivity, working as filopodial bridges which allow the virus to hide from the immune surveillance during cell-to-cell transmission 68.
Finally, autophagy plays a key role in pathogenic infection. The role of autophagy in virus replication has been described as a double-edge sword. Thus, cells exploit autophagy as a mechanism against virus replication as autophagosomes deliver trapped viral cargo to the lysosome for degradation, a process known as “xenophagy”; however, some viruses have developed strategies to sabotage the autophagy mechanism to promote their life cycle 69. A growing body of evidence demonstrates that many RNA and DNA viruses induce divergent autophagy responses 70, 71, 72. Despite an increase in autophagosome formation in the presence of SARS-CoV-2, the virus is capable of impeding the later stages of autophagy, specifically autophagosome-lysosome fusion, thereby resulting in an incomplete autophagy response that appears to favor viral replication 73, 74, 75. Similarly, RSV has been demonstrated to induce autophagy, eventually blocking cell apoptosis 76 and inducing an impairment of autophagolysosomes 77. It is worthy to note that here both RSV and SARS-CoV-2 infections increase, at a transcriptional level, the expression of caveolin-1 (CAV-1) and p62/sequestosome 1 (SQSTM1). The microtubule-associated protein 1 light chain 3 B (LC3B) transcription is particularly boosted by RSV and SARS-CoV-2 single infection, indicating that both viruses promote the autophagosome biogenesis in vitro. Moreover, the ratio between the lipidated and not-lipidated form of LC3B is significantly increased in the co-infection, further suggesting an activation of autophagy flux. Notwithstanding, the IF staining reveals a putative accumulation of autophagosomes represented by the increased number in LC3B puncta co-localizing with p62, a well-known autophagy substrate, confirmed also by TEM images. Hence, it is tempting to speculate that an accumulation of engulfed autophagosomes may occur after the activation of autophagy in the presence of both RSV and SARS-CoV-2 infection, but further analyses are mandatory to better elucidate this hypothesis.
A relatively underexplored area in virus dynamics is the multiple infection of an individual cell. In single infections, some of most solid data come from HIV. Several in vitro, ex vivo and in vivo studies clearly showed that more than one virus can enter the same cell 78, 79, 80, including different cell types such as spleen cells 81. This can occur in different infections from various viruses. A pioneer study 82 evaluated the co-infections of the same cell by different viruses, reporting quite different outcomes depending on virus types. Several hypotheses have been commonly predicated on the “lock and key” concept, that is, as the virus binds to its host receptor, it enters the cell and hijacks the cellular activity, possibly preventing the entrance of other viruses. It is reasonable to suppose that when two or more viruses exhibit the same replication mechanism, the “blockade” or “interference” phenomenon is observed 82 as mathematically assessed 83. Nevertheless, in this study IF and TEM images support the hypothesis that two different viruses, RSV and SARS-CoV-2, can infect the same cell. This is probably due to the fact that there is a degree of intracellular compartmentalization of these two viruses; whether single-cell infection with one or two different viruses could result in the activation of different cellular/molecular pathways is worth of further investigations.
An important variable affecting the nature of virus-virus interference is the time between primary and secondary infections. When infections occur sequentially, factors such as cellular metabolism, resource availability, and immune response shape the dynamics of the secondary pathogen in ways that can be markedly different from those seen in simultaneous infections. The simultaneous infection model adopted in this study is essential to the understanding of how viruses may be inhibiting/boosting each other and shifting the circulation dynamics of respiratory viruses. Further analysis to evaluate the molecular, antiviral and escape mechanisms triggered by in vitro viral co-infections models with different temporal competition are essential to understand the nature of viral dynamics and to possibly identify new pharmacological targets; mainly considering that simultaneous co-infections are expected to be less common than superinfections. Another limitation of the present study arises from the exclusive use of the cell culture system. Overall, our findings provide an overview of the molecular interactions among two respiratory viruses. However, the in vitro model cannot capture the rich ecological niche and the physiological complexity of the whole respiratory tract. Therefore, further in vivo studies are required to verify the impact of our findings on a more complex system. Finally, we acknowledge that our findings are mainly descriptive, as we show a panoramic of the RSV/SARS-CoV-2 intercourse by a combined use of multiple methods. Each result warrants an in-depth examination of the mechanisms that led to it, but it was not the purpose of this single work. Notwithstanding, data gathered in this study and summarized in Figure 9 show an exhaustive overview and suggest that the increased RSV infectious capability observed in the RSV/SARS-CoV-2 co-infection model relies on a combination of structural (filopodial bridges), and cellular (autophagy, ICAM-1) mechanisms which facilitate RSV entry, replication, and survival, implying that the two viruses are collaborative rather than competitive, with direct and/or indirect effects on a severe profile.
The increased RSV infectious capability observed in the RSV/SARS-CoV-2 co-infection model relies on a combination of structural (filopodial bridges), and cellular (autophagy, ICAM-1) mechanisms which facilitate RSV entry, replication, and survival (Fig. 9). This viral, molecular, and cellular fingerprint could justify the increased severity of RSV infection in the context of a concomitant SARS-CoV-2 co-infection. Even accounting for the above-mentioned limitations, this in vitro co-infection model may represent an advantageous cost/effective assay to mimic both viral dynamics and host cellular responses. The future validation of these parameters in in vivo animal models could offer readily measurable targets prognostic of co-infection evolution.
–
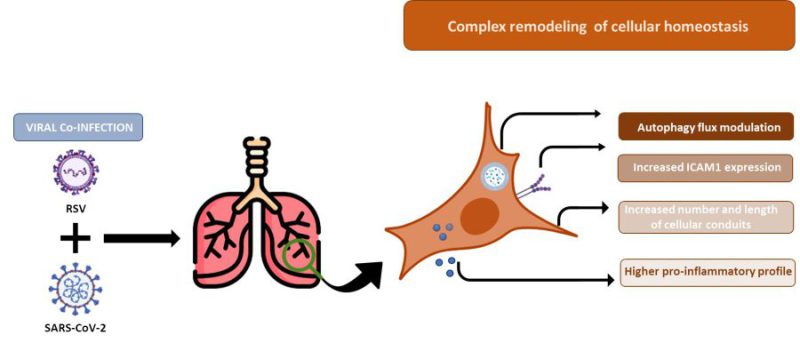 |
FIGURE 9: Summary of cellular remodelling mechanisms induced in A549-hACE2 SARS-CoV-2 and RSV co-infected cell lines. Recapitulatory representation of the main features leading to an increase in RSV replication in A549-hACE2 SARS-CoV-2 co-infected cell lines. |
MATERIAL AND METHODS
Study design, cell cultures and viruses
An in vitro lung epithelial cell model was developed to study the SARS-CoV-2/RSV co-infection (Fig. 1, Fig. 9). A549 (NR-53522, human lung adenocarcinoma cells) expressing Human Angiotensin-Converting Enzyme 2 (A549-hACE2) were obtained through BEI Resources, NIAID, NIH, and Calu-3 (HTB-55, human lung adenocarcinoma cells) were purchased from the American Type Culture Collection (ATCC, USA). A549-hACE2 cells were grown in DMEM high glucose (Euroclone, Milan, Italy), supplemented with 10% Fetal Bovine Serum (FBS, Euroclone, Milan, Italy), and 1% L-Glutamine (Euroclone, Milan, Italy) and 2% Penicillin/Streptomycin (Euroclone, Milan, Italy). Calu-3 cells were grown in DMEM high glucose (Euroclone, Milan, Italy), supplemented with 20% Fetal Bovine Serum (FBS, Euroclone, Milan, Italy), 1% of Non-Essential Amino Acids (NEAA, Thermo Fisher, MA, USA), 1% L-Glutamine (Euroclone, Milan, Italy) and 2% Penicillin/Streptomycin (Euroclone, Milan, Italy). Cells were grown at 37°C in 5% CO2 and at 98% humidity. Cells were routinely checked for mycoplasma contamination by PCR test. Cells between passages 20 and 25 were used for the experiments.
For infection assays, SARS-CoV-2 (Delta strain – lineage B.1.617.2) was isolated from swab and expanded in A549-hACE2 cells. RSV was purchased from BEI Resources, NIAID, NIH (strained A2001/3-12, cat.NR-44231), and expanded in A549-hACE2 cells as well. Infectious viral particle concentration was assessed by TCID50 endpoint dilution assay in A549-hACE2 as previously described 84. In detail, A549-hACE2 cells were plated onto 96-well plates (2 × 10⁴ cells/well) for 24 h and incubated with SARS-CoV-2 or RSV serial 10-fold dilutions, from 106 to 10−4 TCDI50/mL (50 μL) for 3 h at 37°C in 5% CO2. Cells were washed in PBS to remove unbound virus and incubated at 37°C in 5% CO2 for 72 h (for SARS-CoV-2) and 96 h (for RSV). Viral titer from cell supernatants was determined to assess TCID50 through a single-step, real-time, quantitative Reverse Transcriptase-Polymerase Chain Reaction (RT-qPCR). All the experiments with the SARS-CoV-2 and RSV were performed in the BSL3 facility, according to institutional safety guidelines.
RSV-SARS-CoV-2 in vitro co-infection assay
For RSV/SARS-CoV-2 co-infection (Fig.1), 7 × 10⁴ A549-hACE2 cells/well were cultured in a 12 well plate (Euroclone, Milan, Italy) in complete medium, namely DMEM high glucose supplemented with 10% FBS, 1% L-Glutamine and 2% Penicillin/Streptomycin. The next day, A549-hACE2 cells were single-infected or co-infected with SARS-CoV-2 and RSV at the same TCID50 dilution for 3 h in DMEM high glucose supplemented with 2% FBS, 1% L-Glutamine and 2% Penicillin/Streptomycin (Fig. 1). Three hours post-infection (hpi), cells were thoroughly washed three times with pre-warmed PBS (Euroclone, Milan, Italy) and refilled with proper growth medium (DMEM 10% FBS). Viral replication was assessed daily and quantified at 72 hpi by Droplet Digital PCR.
At 48 hpi, the co-infection assay was stopped for IF analysis. At 72 hpi, cells and supernatants were harvested and appropriately stored for further processing as specified below.
RNA extraction and viral assessment by RT-qPCR
For assessment of post-infection viral replication, 200 μL of culture supernatants was collected and RNA was extracted by using Maxwell RSC Viral Total Nucleic Acid Purification Kit (Promega, Fitchburg, WI, USA) through the Maxwell® RSC Instrument (Promega, Fitchburg, WI, USA). Viral RNA was quantified as previously described 85. Briefly, single-step, real-time, RT-qPCR (GoTaq® 1-Step RT-qPCR, Promega, Fitchburg, WI, USA), targeting SARS-CoV-2 nucleocapsid (N) gene and/or RSV N and non-structural (NS) genes (see Supplemental Materials), were used on a CFX96 instrument (Bio-Rad, CA, USA). A cycle threshold (Ct) value of <35 was considered positive, based on CDC guidelines. At 72 hpi, viral RNA was quantified via Droplet Digital PCR.
Viral quantification by Droplet Digital PCR (ddPCR)
Total RNA was extracted from 200 μL of cellular supernatant with Promega kit following manufacturer’s instruction. SARS-CoV-2 and RSV genomic RNA was quantified by the One-Step RT-ddPCR Advanced Kit for Probes (Bio-Rad, CA, USA). Briefly, 5 μL of ddPCR™ Supermix for Probes (No dUTP), 900 nM primers and 250 nM probes, 15 mM DTT, 20 U/μL reverse transcriptase, 2 μL of diluted samples, and nuclease-free water were mixed in a total volume of 20 μL. RNA derived from RSV infection was diluted 1:100; SARS-CoV-2 RNA was diluted 1:10.000 and RSV-RNA derived from co-infection 1:1000. 20 μL were mixed with Droplet Generator Oil for Probes (Bio-Rad, CA, USA) and droplets were generated with the automated droplet generator QX200™ droplet generator (Bio-Rad, CA, USA). Droplets were transferred to a 96-well reaction plate and heat-sealed with a pierce able sealing foil sheet (PX1, PCR plate sealer, Bio-Rad, CA, USA). PCR amplification was performed in a sealed 96-well plate using a T100 thermal cycler (Bio-Rad, CA, USA). Thermal profile was: 50°C for 60 min for reverse transcription, 95°C for 10 min for enzyme activation, and followed by 45 cycles of 95°C for 30 s, 55°C for 60 s, and then 98°C for 10 min for enzyme deactivation. Droplets were read on the QX200™ droplet reader (Bio-Rad) and reactions with less than 10,000 droplets were repeated. concentration was expressed as copies/μL. For ddPCR analysis, the QuantaSoft software version 1.7.4.0917 (Bio-Rad, CA, USA) was used to quantify mRNA.
Cellular RNA extraction, reverse transcription, and gene expression
Cellular RNA isolation, reverse transcription (RT) into cDNA, as well as amplification and quantification through real-time qPCR were performed according to a standardized protocol 85. Briefly, cells were washed in PBS and collected in RNAzol® (Duotech, Milano, Italy), and RNA extraction was performed through the phenol-chloroform (AGPC) extraction method. RNA was diluted in RNase-free water and quantified by the Nanodrop 2000 Instrument (1 μL, Thermo Scientific, Waltham, MA, USA). One μg of RNA was purified from genomic DNA with RNase-free DNase (RQ1 DNase; Promega, WI, USA) and reverse transcribed into first-strand cDNA with Moloney murine leukemia virus reverse transcriptase along with random hexanucleotide primers, oligo dT, and dNTPs (Promega, Fitchburg, WI, USA). cDNA was amplified and quantified by real-time qPCR (CFX96 connect, Bio-Rad, Hercules, CA, USA) by using SYBR Green PCR mix (Promega, Fitchburg, WI, USA), according to the following thermal profile: initial denaturation (95°C, 15 min), denaturation (15 s at 95°C × 40), annealing (1 min at 60°C) and extension (20 s at 72°C). Primers are listed in the Supplemental Materials. Data were analyzed as ΔΔCt and presented as relative ratio between the target gene and the GAPDH housekeeping mRNA.
Multiplex analysis
A 17-cytokine multiplex assay was performed on cellular supernatants using magnetic bead immunoassays (BioRad, CA, USA) and Bioplex 200 Systems (BioRad, CA, USA). Some of the targets resulted to be over-range and arbitrary value of 4000 pg/mL was assigned, while 0.1 pg/mL was attributed to values below the limit of detection.
Immunoblotting
Western blots for p62 and LC3B were carried out on proteins extracted from RNAzol samples as follows. After having removed any remaining acqueous phase, 1:3,33 100% ethanol (Sigma-Aldrich, MO, USA) was added to the lower phase fraction to precipitate DNA. The samples were mixed, incubated 2 min at room temperature (RT) and centrifuged 5000 g at for 10 min at RT. Protein-containing supernants were transferred into a new microtube and 100% ethanol, 100 μL BCP (Sigma-Aldrich, MO, USA) and 600 μL of sterile water (Euroclone, Milan, Italy) /450 μL protein phase were added. Samples were centrifuged 12000 g for 10 min at RT. The upper acqueous phase was removed and discarded, proteins in the interphase were resuspended with 700 μL 100% ethanol/450 μL protein phase, centrifuged 5 min 12000 g at RT and, after letting dry the pellet, resuspended in a mix of 12% glycerol (Sigma-Aldrich, MO, USA), 2% β-mercaptoethanol (Sigma-Aldrich, MO, USA) and 1% Protease inhibitor cocktail (1:100). Lastly, samples were heated up to 50°C in a water bath for 60 min, collected in new microtubes and denatured at 95°C for 5 min. Equal amounts of proteins (10 µg/lane) were separated by standard 10% SDS-PAGE. Proteins were then transferred onto Polyvinylidene Fluoride (PVDF) Transfer Membrane following standard procedures. Membranes were blocked for 1 h with 5% bovine serum albumin (BSA) (Sigma-Aldrich, MO, USA) in Tris-buffered saline containing 0.05% Tween-20 (TBS-T), and probed overnight at 4°C with the following primary antibodies: anti- SQSTM1 (p62) (Cell Signalling, MA, USA), 1:1000 in 5% BSA in TBS-T; anti-LC3B (Cell Signalling, MA, USA) 1:1000 in 5% BSA in TBS-T; anti-β-actin (Sigma-Aldrich, MO, USA), 1:1000 in 5% BSA in TBS-T. After incubation with the appropriate HPR-conjugated secondary antibody (Cell Signalling, MA, USA) (1:10.000 in 5% BSA in TBS-T), immunoreactive bands were visualized by chemiluminescence (ECL, Bio-Rad, CA, USA). Densitometric analyses of immunoblots were performed using the National Institute of Health (NIH) Image J software package.
Immunofluorescence
48 hpi, cells cultured on coverslips were washed in PBS and fixed with 4% paraformaldehyde (PFA, Sigma-Aldrich, MO, USA) for 10 min at RT, followed by permeabilization with 0.1% Triton X-100 in PBS for 10 min at RT, blocking in 5% (BSA) in PBS for 1 h at RT, and incubation for overnight at 4°C in an humified chamber with primary antibodies (Rabbit anti-N Nucleocapsid SARS-CoV-2 Antibody NR-53791, 1:1000, obtained from Bei Resources, NIAID, NIH; Mouse anti-F Fusion RSV 1:500, Abcam, Cambridge, UK; Rabbit anti-LC3B, 1:1500, Cell Signalling, MA, USA; Mouse anti-SQSTM1-P62 1:1500, Cell Signalling, MA, USA), prepared in 1% BSA-PBS. The next day, samples were washed three times with PBS and incubated for 45 minutes at RT with secondary antibodies (Goat anti-mouse Alexa Fluor 488 (ab150113) or 647 (ab150115), or Goat anti-rabbit Alexa Fluor 488 (ab150077) or 647 (ab150079), 1:500, abcam, Cambridge, UK) prepared in 1% BSA-PBS. Negative controls were performed by omitting primary antibodies. After three washes in PBS, coverslips were carefully removed from the wells and mounted on Superfrost glass slides using a mounting medium with DAPI (Enzo Life Sciences, Milan, Italy) and Phalloidin ATT550 (Thermo Fisher, MA, USA). Confocal imaging was performed with a Leica TCS SP5 AOBS microscope system using a 40×/1.30 oil immersion objective (Leica Microsystems, Wetzlar, Germany). The images for the cellular conduit analysis were acquired with an Andor BC43 Benchtop Confocal Microscope and analysed with the built-in Imaris Image Analysis Software, version 10.0.0 (Oxford Instruments, Abingdon-on-Thames, United Kingdom). The images shown in the figures are representative results from independent experiments.
Transmission Electron Microscopy (TEM)
For ultrastructure analysis A549-hACE2 cells were fixed 1h at 4°C in buffered glutaraldehyde and then in 1% osmium tetroxide 1h at room temperature. Then, after dehydration using graded acetone series, all samples were embedded in EMbed-812 resin (Electron Microscopy Sciences, Hatfield USA) using standard methods for ultrastructural analyses. Thin sections were stained with uranyl acetate and lead citrate and analyzed using a ZEISS EM-109 transmission electron microscope (Carl Zeiss, West Germany) with an Olympus Mega View G2 TEM CCD Camera System with integrated TEM imaging Platform iTEM (Olympus, Germany). The identification of virions was carried out at high magnification (≈X140.000).
Flow cytometry
At 72 hpi, A549-hACE2 cells were trypsinized and harvested in complete medium. After 8 min of centrifuge, supernatant was discarded and cells were then resuspended at the concentration of 5×10⁵ cells/100 μL of PBS incubated with the monoclonal antibody to detect surface ICAM1 (CD54 Pacific Blue, BioLegend, CA, USA) and a live/dead marker (ViaKrome Fixable Viability Dyes, Beckman Coulter, CA, USA) for 15 min at RT, protected by light. Then, cells were washed with PBS and fixed in 1% paraformaldehyde (PFA, Sigma-Aldrich, MO, USA). Samples acquisition was performed on a CytoFLEX™ flow cytometer system equipped with CytExpert software (Beckman Coulter, CA, USA), and data were analysed using Kaluza software, version 2.1.1. (Beckman Coulter, CA, USA).
Statistical analysis
The Student’s t-test was done when appropriate for statistical analysis to compare continuous variables. One-way ANOVA or Two-way ANOVA were applied for non-parametric multiple comparisons. A p-value < 0.05 was chosen as the cut-off for significance. Data were analysed with GraphPad Prism 9.
Availability of data and materials
All raw data and materials will be made available following a reasonable request.
REFERENCES
For full bibliography please see the pdf file.
SUPPLEMENTAL INFORMATION
 Download Supplemental Information
AUTHOR CONTRIBUTIONS
C.V. designed the study, performed the experiments, analysed the data and wrote the manuscript. I.S. performed the droplet digital PCR and analysed the data. V.A. contributed to the experiments. S.Z. performed the immunofluorescence experiments. C.M., A.T. and M.N. performed and analysed the transmission electron microscopy experiments. G.C., S.S., M.G., M.B., P.O. and F.L. contributed to the experiments. C.F., M.C. and D.T. revised the final draft of the paper. M.B. conceived and supervised the study, wrote and revised the manuscript. All authors read and approved the final manuscript.
ACKNOWLEDGMENTS
The authors thank Dr Maria Sole Casentini and Dr Marco Lorenzi (Alfatest, Cernusco sul Naviglio, Italy) for having invited us to a DEMO session and having given the technical support to employ the Andor BC43 Benchtop Confocal Microscope for image acquisition and analyses.
Partially supported by grants from Fondazione Romeo and Enrica Invernizzi; PNRR-Spoke 13-CUP-G43C2200260007-INF- ACT.
COPYRIGHT
© 2024

A complex remodeling of cellular homeostasis distinguishes RSV/SARS-CoV-2 co-infected A549-hACE2 expressing cell lines by Vanetti et al. is licensed under a Creative Commons Attribution 4.0 International License.