Research Articles:
Microbial Cell, Vol. 2, No. 12, pp. 466 - 480; doi: 10.15698/mic2015.12.241
A central role for TOR signalling in a yeast model for juvenile CLN3 disease
1 MRC Laboratory for Molecular Cell Biology, University College London, London WC1E 6BT, UK.
2 UCL Institute of Child Health, 30 Guilford Street, London WC1N 1EH, UK.
3 Department of Genetics, Evolution and Environment, University College London, London WC1E 6BT, UK.
4 Institute of Healthy Ageing, University College London, London WC1E 6BT, UK.
Keywords: Batten disease, NCL, CLN3, btn1, Tor, TORC, S. pombe, yeast.
Abbreviations:
CWI - cell wall integrity,
NCLs - neuronal ceroid lipofuscinosis,
SAPK - stress-associated protein kinase,
SGA - synthetic genetic array,
WT - wild-type.
Received originally: 06/08/2015 Received in revised form: 12/10/2015
Accepted: 14/10/2015
Published: 11/11/2015
Correspondence:
Sara E. Mole, MRC Laboratory for Molecular Cell Biology, University College London; London WC1E 6BT, UK s.mole@ucl.ac.uk
Conflict of interest statement:
The authors declare no conflict of interest.
Please cite this article as: Michael E. Bond, Rachel Brown, Charalampos Rallis, Jürg Bähler and Sara E. Mole (2015). A central role for TOR signalling in a yeast model for juvenile CLN3 disease. Microbial Cell 2(12): 466-480.
Abstract
Yeasts provide an excellent genetically tractable eukaryotic system for investigating the function of genes in their biological context, and are especially relevant for those conserved genes that cause disease. We study the role of btn1, the orthologue of a human gene that underlies an early onset neurodegenerative disease (juvenile CLN3 disease, neuronal ceroid lipofuscinosis (NCLs) or Batten disease) in the fission yeast Schizosaccharomyces pombe. A global screen for genetic interactions with btn1 highlighted a conserved key signalling hub in which multiple components functionally relate to this conserved disease gene. This signalling hub includes two major mitogen-activated protein kinase (MAPK) cascades, and centers on the Tor kinase complexes TORC1 and TORC2. We confirmed that yeast cells modelling CLN3 disease exhibit features consistent with dysfunction in the TORC pathways, and showed that modulating TORC function leads to a comprehensive rescue of defects in this yeast disease model. The same pathways may be novel targets in the development of therapies for the NCLs and related diseases.
INTRODUCTION
Yeasts have long been used as model systems to shed light on basic eukaryotic cell biology, and can provide a rapid and comprehensive route of investigation for genes of unknown function. This is particularly relevant for those genes that are conserved across diverse eukaryotic species and which can be presumed to play a fundamental biological role. A significant health challenge facing current research and drug development is the increasing incidence of age-related neurodegenerative disorders. Elucidating the mechanisms that underlie neurodegeneration is complex, particularly so in common age-related dementias that may have numerous contributing factors. There are, however, monogenic inherited neurodegenerative diseases that present a simpler alternative for investigation and real opportunities to determine these basic cellular changes, and some of the underlying genes are conserved even in yeasts. The genetic tractability of yeasts offers particular advantages to the challenges of understanding disease mechanisms in a relevant biological context and this knowledge can inform therapeutic development for such conserved genetic diseases.
–
The neuronal ceroid lipofuscinoses (NCLs) are such a group of monogenic neurodegenerative disorders that generally affect children [1]. The most common of these is juvenile CLN3 disease [2]. This disease is characterised by progressive neuronal atrophy that causes visual failure, seizures and a progressive decline in cognitive and motor function. This disease is accompanied by cellular features characteristic of many neurodegenerative conditions [3][4] that include the dysfunction of core cellular processes, such as reduced lysosomal and autophagic clearance [5][6] and mitochondrial abnormalities [7]. Moreover, CLN3 disease also leads to specific cellular pathologies characteristic of more common dementias. These include the accumulation of lipofuscin [1], as observed in aged neurons [4], aberrant amyloid-β processing [5], a feature of Alzheimer’s disease [8] and α-synuclein accumulation [9], a feature of Parkinson’s disease [10].
–
Juvenile CLN3 disease is caused by mutations in a single gene (CLN3) [2], whose function is unknown but which is highly conserved across eukaryotic species [11]. As a consequence, this disease is relatively straightforward to reproduce in experimental systems and, given its similarity to more common dementias, such experimental models are ideal paradigms to study the basic cellular changes that occur in neurodegenerative diseases. The fission yeast Schizosaccharomyces pombe contains a single orthologue of CLN3 (btn1) [11]. Work in this yeast has revealed a role for btn1 in many cellular processes. Like patient cells, yeast lacking btn1 (btn1Δ) have enlarged and less acidic vacuoles [12] and further work has supported roles for btn1 in vacuolar homeostasis [13]. The ability of btn1 modeling the most common CLN3 mutation (a 1 Kb deletion) to rescue these vacuolar defects found in the btn1Δ null strain has also revealed that this mutant allele retains some function, making juvenile CLN3 disease a mutation-specific disease rather than the consequence of a complete loss of function as originally assumed [14].
–
A host of further morphological defects exhibited in the btn1Δ strain support additional roles for btn1 in cytokinesis [12] and the organisation of cell polarity [15]. Furthermore, btn1Δ cells also display cell wall defects [16]. Importantly, work in this model has expanded our understanding of the disease by revealing that btn1 is involved in two independent pathways; one pH-dependent and one pH-independent, thus providing the first suggestion that Batten disease is more than a pH-related lysosome disorder [16]. Indeed, a comprehensive metabolomics approach has revealed that btn1 is required for the regulation of glycolysis and amino acid homeostasis [17]. The involvement of btn1 in numerous, apparently disparate, pathways may be a result of alterations at the Golgi apparatus, as the number, morphology, and location of thus organelle are affected by its deletion [13]. Lastly, this model has been used successfully to model disease mutations in Btn1p, an effort that has provided valuable insight into their consequences on protein trafficking and function. It was found that equivalent CLN3 disease mutations in btn1 affect the yeast phenotype in a way that can accurately predict the severity of disease, further establishing yeast as an accurate disease model despite its simplicity. Importantly, the observations reported in the fission yeast model have consistently been confirmed in mammalian systems [5][18][19]. Unfortunately however, despite these insights, the molecular processes that underlie cell death in this disease are poorly understood, the function of CLN3 is unknown, and there remains a significant need for protective therapeutic targets.
–
A particular advantage of yeast model systems is the availability of genome-wide techniques. Synthetic genetic arrays (SGAs) have proved a particularly powerful means of exploring genetic interactions in yeast species [20]. This approach highlights genes involved in pathways parallel to, or converging with, the query gene. This provides information about functional relationships among genes, as well as processes that suppress the defects associated with a particular mutation. As they are hypothesis-free, SGAs are particularly valuable in the investigation of complex biological problems and those where gene function is unclear. These advantages are particularly relevant for neurodegeneration in general, due to the complexity of the problem, and for juvenile CLN3 disease in particular, due to the lack of a clear gene function. SGAs have previously been employed in budding yeast to investigate mutant huntingtin and α-synuclein toxicity [21]. Such an approach can place the gene under investigation within its biological context and thereby uncover much-needed protective pathways for neurodegenerative disease.
–
We applied SGA analysis to identify pathways that are altered as a consequence of loss of function of btn1 in an effort to better understand the molecular consequences of CLN3 disease, and to provide new candidate target pathways and processes for therapeutic development. A third of the genetic interactions that were identified centered on a set of conserved and connected signalling pathways. Manipulation of these pathways leads to a complete rescue of the pleiotropic array of btn1Δ phenotypes. This approach represents the most successful rescue of cellular dysfunction in any model for juvenile CLN3 disease to date.
RESULTS
Genome-wide analysis of genetic interactions with btn1 reveals a central role for TOR kinases
We applied an SGA approach as an unbiased, genome-wide strategy to probe the interactions of a conserved neurodegenerative disease gene (btn1). We identified 331 positive interactors and 131 negative interactors of btn1 (Table S1A and B). A large number of negative interactions (n = 39; 29.7%) mapped to a set of highly interconnected signalling processes, which center on the Tor kinase complexes TORC1 and TORC2 (Fig. 1). Core components of both complexes display genetic interactions with btn1; tco89, encoding a component of TORC1, was found to interact positively with btn1, while tor1, encoding the Tor kinase of TORC2, was found to interact negatively with btn1. Such a pattern suggests that TORC2 signalling is beneficial to the fitness of btn1Δ cells, whereas TORC1 signalling is detrimental, an observation that is in keeping with the idea that the two complexes play opposing roles and undergo mutual repression [22][23][24]. btn1 was also found to negatively interact with genes encoding components of the connected cell wall integrity (CWI) and stress-associated protein kinase (SAPK) MAP kinase cascades, and a number of down-stream stress regulated genes (Table S1A and B).
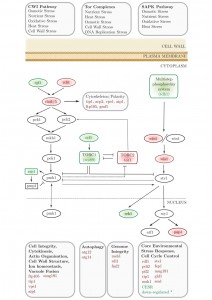 | FIGURE 1: Synthetic genetic array (SGA) analysis of the genetic interactions of btn1. A schematic of the genes involved in stress responses that genetically interact with btn1. Genes in red were identified as negative interactors and those in green as positive. Grey genes are involved in these pathways but were not found to interact with btn1. * CESR refers to ‘core environmental stress response’ genes, a group of genes that respond to most environmental stressors as described by Chen et al. (2003) [25]. |
btn1Δ cells display features consistent with dysfunctional Tor signalling
The interaction of btn1 with core TORC components, and the link to surrounding signalling processes, provides compelling evidence for the importance of Tor signalling in cells lacking btn1. To validate this observation, we investigated btn1Δ cells for features consistent with Tor dysfunction. Repression of TORC1 activity is required to mount a correct response to nitrogen limitation [24]. As loss of TORC1 activity was beneficial in cells lacking btn1, we hypothesised that these cells may display features consistent with dysregulation of TORC1 repression, and respond poorly to nitrogen limitation. To test this idea, we grew wild-type and btn1Δ cells in minimal media, and minimal media lacking a nitrogen source, over 72 h. Viability was monitored at 24 h intervals using propidium iodide to label dead cells and calcofluor white to label the total cell population (Fig. 2A). Cells lacking btn1 displayed a consistently lower viability in media lacking nitrogen, falling to 81.5 ± 2.2% after 24 h compared to 98.7 ± 0.27% in minimal media containing nitrogen (P < 0.0015, unpaired t test), and remaining lower throughout the time course. Wild-type cells displayed no change in viability when cultured in media lacking nitrogen.
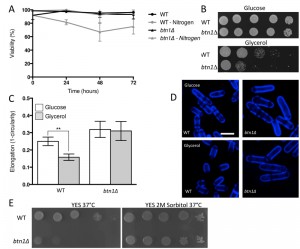 | FIGURE 2: btn1Δ cells display features consistent with dysfunction in TOR signalling processes. (A) Cell viability upon nitrogen limitation was determined over periods of up to 72 hours in wild-type (WT) and btn1Δ cells, using the cell impermeable nucleotide stain propidium iodide to stain dead cells and calcofluor white to stain the total cell population. Cells were cultured in either MM or MM lacking a nitrogen source (NH4Cl). 500 cells were scored for viability per data set, and data shown is a mean (± SEM) of 3 independent experiments. (B) WT cells and btn1Δ cells were serially diluted from a log-phase culture (1 x 10⁶ cells/ml), and spotted onto plates containing either glucose or glycerol as a carbon source. Plates were then incubated at 30°C for 6 - 7 days to determine growth on fermentative and non-fermentative carbon sources. Images are representative of three independent experiments. (C) The morphological response of WT and btn1Δ cells to growth on glycerol was analysed following 6 hours in culture using a measure of cell elongation, on a scale of 0 to 1, where 0 represents a perfectly round cell (1-(4π*area/perimeter2)). Data shown is a mean (± SEM) of 5 independent experiments. Statistical significance between each condition was determined using a one-way ANOVA with a Tukey’s multiple comparison post-test (** = P < 0.01). (D) Representative images of experiments as performed in (C) are shown. Scale bar represents 10 μm. (E) WT and btn1Δ cells were also serially diluted from a log-phase culture (1 x 10⁶ cells/ml) and spotted onto YES plates and YES plates containing 2M sorbitol. Plates were then incubated at 37°C for 3 - 4 days to determine the growth at high temperature and the influence of osmotic stabilisation. Images are representative of three independent experiments. |
TORC1 repression and TORC2 signalling is also required to mount a response to glucose limitation [25][26]. Cells that are defective in TORC2 function do not respond appropriately to glucose limitation by reducing their cell length [26]. This is a relatively uncommon phenotype, with only tor1 mutants and mutants in the Ca2+/calmodulin-dependent-like gene ssp1 known to display this phenotype [26][27]. To test the ability of btn1Δ cells to adapt to conditions of limited glucose, we assessed both cell growth and the morphological response of these cells when grown with an alternative carbon source (glycerol). Cells lacking btn1 displayed a clear growth defect under these conditions (Fig. 2B). Wild-type and btn1Δ cells grown for 6 h in media containing either glucose or glycerol as a carbon source were stained with calcofluor white to visualise the cell wall. Cell elongation was determined using a measure of cell circularity and given a score of between 0 and 1, where 0 represents a perfectly round cell (Fig. 2C and D). Wild-type cells displayed a significant reduction in cell elongation upon growth in glycerol (0.25 ± 0.01 to 0.16 ± 0.01, P ≤ 0.01). Cells lacking btn1, however, displayed no significant change (0.32 ± 0.02 to 0.31 ± 0.02), consistent with a defect in their response to glucose limitation that is most likely linked to Tor1 function.
–
Lastly, TORC2 and the connected CWI pathway are also required for resistance to high temperature [26]. This temperature sensitivity of TORC2 and CWI pathway components is osmoremedial, i.e. it can be rescued by hypertonic growth media [28]. We confirmed the temperature sensitivity of btn1Δ cells, and that it can be rescued with 2M sorbitol (Fig. 2E), consistent with previous observations [16].
–
These data together indicate that cells lacking btn1 display many features consistent with defects in Tor signalling and function. Further, ectopic expression of btn1 was able to rescue all these aspects of the mutant phenotype (Fig. S1A – D). Combined with the SGA results, these results suggest that Tor signalling is critical to the defects observed in btn1Δ cells.
–
TORC2 and CWI pathway: modulating distinct signalling nodes elicit different levels of correction in btn1Δ cells
Given the negative genetic interaction between btn1 and tor1, increasing TORC2 activity could alleviate aspects of the btn1Δ phenotype. We initially explored this approach through overexpression of the downstream kinase Gad8, which is a multicopy suppressor of aspects of the loss of TORC2 [29]. A key phenotype in cells lacking btn1, and one that is strongly linked to the phenotype of CLN3 disease, is a change in vacuole homeostasis [12]. One of the clearest manifestations of this feature in btn1Δ cells is an increase in vacuole size [12]. We investigated vacuole size in wild-type and btn1Δ cells containing empty vector alone (as a control), as well as btn1Δ cells expressing gad8 from the nmt1 promoter of the pREP41 plasmid (Fig. 3A and B). Consistent with previous reports, btn1Δ cells exhibited significantly larger vacuoles than wild-type cells (0.65 ± 0.03 μm compared to 0.39 ± 0.01 μm, P ≤ 0.001). The overexpression of gad8 in btn1Δ cells significantly rescued vacuole size (0.40 ± 0.03 μm) (P ≤ 0.01), restoring them to near that of wild-type. These data provide the first indication that increasing TORC2 function significantly rescues a disease-relevant phenotype of btn1Δ cells.
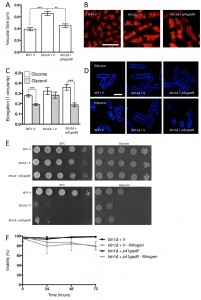 | FIGURE 3: Increasing TORC2-dependent signalling rescues aspects of btn1Δ phenotype. (A) Cells lacking btn1 were transformed with an expression vector containing gad8. Vacuole size was measured in these cells, in addition to WT and btn1Δ cells containing empty vector, following staining with the vital dye FM4-64. The diameter of 300 vacuoles was determined per data set, and data shown is a mean (± SEM) of 4 independent experiments. Statistical analysis was performed using a one-way ANOVA with a Tukey’s multiple comparison post-test (** = P < 0.01, *** = P < 0.001). (B) Representative images of experiments as performed in (A) are shown. Scale bar represents 10 μm. (C) The morphological response of these populations to growth on glycerol was analysed following 6 hours in culture using a measure of cell elongation, on a scale of 0 to 1, where 0 represents a perfectly round cell (1-(4π*area/perimeter2)). Data shown is a mean (± SEM) of 5 independent experiments. Statistical significance between each condition was determined using a one-way ANOVA with a Tukey’s multiple comparison post-test (*** = P < 0.001). (D) Representative images of experiments as performed in (C) are shown. Scale bar represents 10 μm. (E) These cells were serially diluted from a log-phase culture (1 x 10⁶ cells/ml) and spotted onto YES plates. Plates were then incubated at 30°C or 37°C for 3 - 4 days to determine growth at high temperature. They were also spotted onto plates containing either glucose or glycerol as a carbon source. Plates were then incubated at 30°C for 6 - 7 days to determine growth under non-fermentative conditions. Images are representative of three independent experiments. (F) Viability upon nitrogen limitation was determined over periods of up to 72 hours in these cell populations, using propidium iodide to stain dead cells and calcofluor white to stain all cells. Cells were cultured in either MM or MM lacking a nitrogen source (NH4Cl). 500 cells were scored for viability per data set, and data shown is a mean (± SEM) of 3 independent experiments. |
As discussed above, the ability of cells to respond to glucose-limitation with a change in cell size requires TORC2 function [26]. To investigate whether the inability of btn1Δ cells to undergo this morphological response can be rescued by increasing TORC2 pathway activity, we assessed the elongation of btn1Δ cells overexpressing gad8 following growth for 6 hours in media containing either glucose or glycerol as a carbon source (Fig. 3C and D). Wild-type and btn1Δ cells containing empty vector alone displayed comparable responses to cells without vector (WT glucose – 0.28 ± 0.01, WT glycerol – 0.19 ± 0.01, P ≤ 0.001; btn1Δ glucose – 0.32 ± 0.02, btn1Δ glycerol – 0.28 ± 0.01, ns). The overexpression of gad8 was able to significantly rescue this morphological response, despite these cells being elongated under growth in glucose (glucose – 0.36 ± 0.01, glycerol – 0.19 ± 0.01, P ≤ 0.001).
–
Despite this rescue, expression of gad8 was unable to significantly rescue the growth of btn1Δ cells on glycerol or at high temperature, suggesting that the ability of these cells to adapt to heat and nutrient stress is still impaired (Fig. 3E). Similarly, expression of gad8 was unable to rescue the viability of btn1Δ cells grown in the absence of a nitrogen source (Fig. 3F).
–
Given that the phenotypes not rescued by increasing TORC2 activity were linked to stress and nutrient adaptation, we reasoned that modulating processes more closely linked to the CWI pathway might be more effective in correcting these phenotypes. These processes seem particularly relevant in this instance, as this pathway is known to respond to both heat and glucose limitation. In particular, mutants of the pmk1 MAP kinase, like btn1Δ mutants, display a partial growth defect on glycerol. Further, this pathway is required for proper activation of Sty1 (the MAP kinase of the SAPK pathway) under glucose-limitation, integrating these processes with further identified btn1 interactors [30].
–
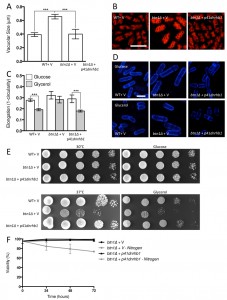
To increase CWI activity, we chose to increase Rho GTPase levels in these cells, which represent a key hub in CWI pathway regulation, by overexpressing the btn1 interactor rho5 and its essential paralogue rho1. Overexpression of rho1 significantly decreased vacuole size in btn1Δ cells (P ≤ 0.001) to near that of wild-type cells containing empty vector alone (WT – 0.30 ± 0.02 μm, btn1Δ – 0.47 ± 0.04 μm, btn1Δ with p41rho1 – 0.32 ± 0.01 μm) (Fig. 4A and B). The overexpression of rho5 led to an over-correction of this phenotype (0.19 ± 0.01 μm), producing vacuoles significantly smaller than those of btn1Δ cells (P ≤ 0.001) and wild-type cells containing vector alone (P ≤ 0.05). Consistent with these observations, over-expression of pmp1, which inhibits the activity of pmk1 [31], caused an increase in vacuole size in btn1Δ cells (btn1Δ with p41pmp1 – 0.80 ± 0.08 μm vs btn1Δ – 0.52 ± 0.04 μm, P ≤ 0.01) but not in wild-type cells (WT with p41pmp1 – 0.24 ± 0.01 μm vs WT – 0.23 ± 0.02, ns) (Fig. 4C). Such data indicate that increasing CWI pathway activity is able to correct the vacuole defect of btn1Δ cells, and directly inhibiting this pathway exacerbates the vacuole defect. The over-correction by rho5 could indicate a strong dose-dependence in this particular rescue. Indeed, previous work has demonstrated such dose dependence in the relationship between btn1 and vacuole size [12].
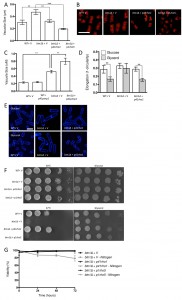 | FIGURE 4: Overexpression of Rho rescues all aspects of btn1Δ phenotype. (A) Cells lacking btn1 were transformed with an expression vector containing rho1 or rho5. Vacuole size was measured in these cells, in addition to wild-type (WT) and btn1Δ cells containing empty vector, following staining with the vital dye FM4-64. The diameter of 300 vacuoles was measured per data set, and data shown is a mean (±SEM) of 4 independent experiments. Statistical analysis was performed using a one-way ANOVA with a Tukey’s multiple comparison post-test (** = P < 0.01, *** = P < 0.001). (B) Representative images are shown in lower panels. Scale bar represents 10 μm. (C) WT and cells lacking btn1 were transformed with an expression vector containing pmp1. Vacuoles were stained and measured as for (A). Statistical analysis was performed using a one-way ANOVA with a Tukey’s multiple comparison post-test (** = P < 0.01). (D) The morphological response of WT and btn1Δ cells containing empty vector as well as btn1Δ cells overexpressing rho1 to growth on glycerol was analysed following 6 hours in culture using a measure of cell elongation, on a scale of 0 to 1, where 0 represents a perfectly round cell (1-(4π*area/perimeter2)). Data shown is a mean (±SEM) of 5 independent experiments. Statistical significance between each condition was determined using a one-way ANOVA with a Tukey’s multiple comparison post-test (** = P < 0.01). (E) Representative images of experiments as performed in (D) are shown. Scale bar represents 10 μm. (F) Wild-type and btn1Δ cells containing empty vector as well as btn1Δ cells overexpressing rho1 and rho5 were serially diluted from a log-phase culture (1 x 10⁶ cells/ml) and spotted onto YES plates. Plates were then incubated at 30°C or 37°C for 3-4 days to determine growth at high temperature. They were also spotted onto plates containing either glucose or glycerol as a carbon source. Plates were then incubated at 30°C for 6-7 days to determine growth under non-fermentative conditions. Images are representative of three independent experiments. (G) Viability upon nitrogen limitation was determined over periods of up to 72 hours in these cell populations, using propidium iodide to stain dead cells and calcofluor white to stain all cells. Cells were cultured in either MM or MM lacking a nitrogen source (NH4Cl). 500 cells were scored for viability per data set, and data shown is a mean (±SEM) of 3 independent experiments. |
We next investigated whether the Rho GTPases were able to rescue the morphological response of these cells to glycerol, as seen with gad8. We looked just at rho1 in this case, as rho5 overexpression has a pronounced effect on cell shape and septation [32], making morphological comparisons difficult (Fig. S2). Overexpression of rho1 elicited a rescue of this response, with cells displaying a significant reduction in cell elongation when grown in glycerol containing media (0.28 ± 0.02 to 0.16 ± 0.01, P ≤ 0.01) (Fig. 4D and E).
–
Further to a rescue of the morphological response to glycerol, both rho1 and rho5 were able to correct the growth defect of btn1Δ cells on glycerol as a carbon source. In addition, rho1 was able to rescue the temperature sensitivity phenotype of these cells (Fig. 4F). The overexpression of rho5 did not correct this phenotype, although, given the link between heat-sensitivity and septation defects in btn1Δ cells [15] and the enhanced septation defect of cells overexpressing rho5 (Fig. S2), this is not wholly unexpected.
–
In addition to these phenotypes, overexpression of rho1 and rho5 rescued the viability of btn1Δ cells when grown in the absence of a nitrogen source, with viability remaining higher than 95% throughout the course of the experiment (Fig. 4G). These data provide evidence for a profound positive interaction between CWI pathway signalling and btn1, indicating that such processes are intimately linked with the defects that occur in btn1Δ cells.
–
Reducing TORC1 activity corrects defects in btn1Δ cells
TORC1 activity is a key signal of a favourable environment, promoting proliferation and suppressing stress-responsive processes [24]. As a consequence, it is antagonistic to many of the processes explored in this study that improved the btn1Δ phenotype. TORC1 represses TORC2 function [23], and negatively regulates Sty1 [33], which displays extensive cross-talk with the CWI pathway [30]. This relationship is highlighted by the fact that the core TORC1 component gene tco89 is a positive interactor of btn1.
–
In order to test whether repression of TORC1 activity could rescue the phenotypes of btn1Δ cells, we first overexpressed a dominant-negative form of the upstream activator of TORC1, Rhb1 (rhb1D60K) [34]. Upon overexpression of dominant-negative rhb1 (dnrhb1) in btn1Δ cells, we observed a significant reduction (P ≤ 0.001) in vacuole size compared to btn1Δ cells containing vector alone (btn1Δ with p41dnrhb1 – 0.40 ± 0.04 μm, btn1Δ with empty vector – 0.65 ± 0.03 μm) (Fig. 5A and B). This result was comparable to the vacuole size of wild-type cells (0.39 ± 0.01 μm), indicating a rescue of vacuole morphology upon repression of TORC1 activity.
 | FIGURE 5: Inhibiting TORC1 function rescues the defects in btn1Δ cells. (A) Cells lacking btn1 were transformed with an expression vector containing a dominant-negative form of rhb1 (dnrhb1). Vacuole size was measured in these cells, in addition to wild-type (WT) and btn1Δ cells containing empty vector, following staining with the vital dye FM4-64. The diameter of 300 vacuoles was measured per data set, and data shown is a mean (± SEM) of 4 independent experiments. Statistical analysis was performed using a one-way ANOVA with a Tukey’s multiple comparison post-test (*** = P < 0.001). (B) Representative images of experiments as performed in (A) shown. Scale bar represents 10 μm. (C) The morphological response of these populations to growth on glycerol was analysed following 6 hours in culture using a measure of cell elongation, on a scale of 0 to 1, where 0 represents a perfectly round cell (1-(4π*area/perimeter2)). Data shown is a mean (± SEM) of 5 independent experiments. Statistical significance between each condition was determined using a one-way ANOVA with a Tukey’s multiple comparison post-test (*** = P < 0.001). (D) Representative images of experiments as performed in (C) shown. Scale bar represents 10 μm. (E) These cells were serially diluted from a log-phase culture (1 x 10⁶ cells/ml) and spotted onto YES plates. Plates were then incubated at 30°C or 37°C for 3-4 days to determine growth at high temperature. They were also spotted onto plates containing either glucose or glycerol as a carbon source. Plates were then incubated at 30°C for 6-7 days to determine growth under non-fermentative conditions. Images are representative of three independent experiments. (F) Viability upon nitrogen limitation was determined over periods of up to 72 hours in these cell populations, using propidium iodide to stain dead cells and calcofluor white to stain all cells. Cells were cultured in either MM or MM lacking a nitrogen source (NH4Cl). 500 cells were scored for viability per data set, and data shown is a mean (± SEM) of 3 independent experiments. Scale bar represents 10 μm. |
We next investigated the ability of TORC1 repression to rescue the nutrient-sensing defects of cells lacking btn1. The overexpression of dnrhb1 led to a significant rescue of the morphological response of these cells to glucose-limitation, following 6 hours growth in glycerol as a carbon source (Fig. 5C and D). Cell elongation fell from 0.29 ± 0.02 to 0.18 ± 0.01 when grown in glycerol as opposed to glucose, a response comparable to that observed in wild-type cells (glucose – 0.28 ± 0.01, glycerol – 0.19 ± 0.01). This also corresponded to a rescue of the growth defect of these cells on glycerol (Fig. 5E). Further to the glycerol growth defect, dnrhb1 overexpression also rescued the heat sensitivity of btn1Δ cells (Fig. 5E). Finally, this construct was also able to elicit a complete rescue of viability under nitrogen limiting conditions, with viability remaining above 95% throughout the course of the experiment (Fig. 5F).
–
Given the substantial rescue of btn1Δ cells by dnrhb1-mediated activation of TORC1, we wanted to confirm the interaction between btn1 and TORC1 by another means. We chose to use two pharmacological inhibitors of TORC1, rapamycin (allosteric) and caffeine (competitive inhibitor of ATP binding) [35]. TORC1 antagonism leads to cell rounding, a response that mimics the morphological change ordinarily exhibited by wild-type cells in response to nitrogen and amino acid starvation. Therefore, we examined the effect of TORC1 antagonism on cell rounding [36] and on vacuole size, heat sensitivity, and growth in glycerol. As expected, wild-type cells displayed a significant reduction in cell elongation upon rapamycin treatment for 6 hours (0.26 ± 0.02 to 0.15 ± 0.01, P ≤ 0.01) (Fig. 6A and B). This reduction in cell elongation did not change further upon exposure to both rapamycin and caffeine [35]. Cells lacking btn1, however, did not respond to rapamycin, displaying only a slight morphological change (0.30 ± 0.01 to 0.25 ± 0.02) that was slightly enhanced by the addition of caffeine and rapamycin, but again not significantly (0.22 ± 0.03) (Fig. 6A and B). The addition of caffeine and rapamycin to wild-type cells did not significantly affect vacuole size (vehicle – 0.37 ± 0.05 μm, rapamycin – 0.31 ± 0.03, caffeine and rapamycin 0.24 ± 0.01) (Fig. 6C and D). Rapamycin alone had no effect on the vacuole size of cells lacking btn1, but, in contrast, a combination of caffeine and rapamycin significantly (P ≤ 0.001) reduced vacuole size (vehicle – 0.58 ± 0.03 μm, rapamycin – 0.55 ± 0.04, caffeine and rapamycin 0.30 ± 0.02) (Fig. 6C and D). Further, treatment with rapamycin alone elicited a rescue of both the heat sensitivity defect and glycerol growth defect of cells lacking btn1 (Fig. 6E). The ability of these pharmacological treatments to rescue the defects in vacuole size, heat sensitivity and growth in glycerol of btn1Δ cells appears to be closely linked to their ability to target TORC1 signalling itself, as opposed to changes in the activity of the connected SAPK pathway, as expression of a constitutively active wis1 mutant (wis1DD) [37] did not rescue these phenotypes (Fig S3A – C). These data confirm that activation of the TORC1 pathway pharmacologically in btn1Δ cells rescues most of the phenotypes arising from loss of btn1 function. However, the pharmacological inhibition of the TORC1 pathway is not completely equivalent to the inhibition of the TORC1 pathway using dnrhb1 in btn1Δ cells.
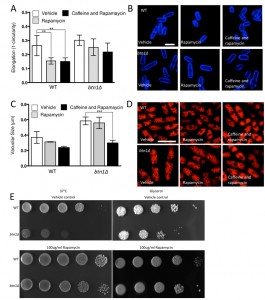 | FIGURE 6: Pharmacological inhibition of TORC1 function replicates rescue by overexpression of dominant-negative rhb1. (A) The morphological response of wild-type (WT) and btn1Δ cells to the TORC1 antagonists rapamycin (100 μg/ml) and caffeine and rapamycin combined (10 mM and 100 μg/ml respectively) was analysed following 6 hours in culture using a measure of cell elongation, on a scale of 0 to 1, where 0 represents a perfectly round cell (1-(4π*area/perimeter2)). Data shown is a mean (± SEM) of 6 independent experiments. Statistical significance between each condition was determined using a one-way ANOVA with a Tukey’s multiple comparison post-test (** = P < 0.01). (B) Representative images of experiments as performed in (A) are shown. Scale bar represents 10 μm. (C) Wild-type and btn1Δ cells were grown for 6 hours in MM alone or with the TORC1 antagonists rapamycin (100 μg/ml) and caffeine and rapamycin (10 mM and 100 μg/ml respectively). Vacuole size was then measured in these cells following staining with the vital dye FM4-64. The diameter of 300 vacuoles was measured per data set, and data shown is a mean (± SEM) of 4 independent experiments. Statistical analysis was performed using a one-way ANOVA with a Tukey’s multiple comparison post-test (*** = P < 0.001). (D) Representative images of experiments as performed in (C) are shown. Scale bar represents 10 μm. (E) WT and btn1Δ cells were serially diluted from a log-phase culture (1 x 10⁶ cells/ml) and spotted onto YES plates either containing or lacking rapamycin (100 μg/ml). Plates were then incubated at 37°C for 3-4 days to determine growth at high temperature. They were also spotted onto plates containing glycerol as a carbon source either containing or lacking rapamycin (100 μg/ml). Plates were then incubated at 30°C for 6-7 days to determine growth under non-fermentative conditions. Images are representative of three independent experiments. |
DISCUSSION
In this study, SGA analysis was used as an unbiased approach to identify the genetic interactors of btn1, and place btn1 into its biological context within the whole cell. This approach highlighted a key role for the Tor kinase complexes, TORC1 and TORC2, in the dysfunctional changes that occur in fission yeast lacking btn1, as one third of the interactions connected directly with pathways in which these complexes are active. Further, we have shown that btn1Δ cells display defects in their stress response to nitrogen and glucose limitation, in addition to osmoremedial heat sensitivity, consistent with TORC1 and TORC2 dysfunction in these cells (Fig. 7).
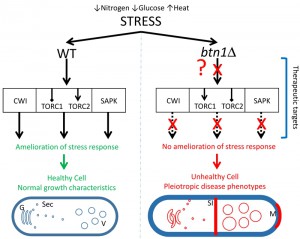 | FIGURE 7: Diagrammatic summary of the effect of loss of btn1 on the response to stress. The left panel shows the response of healthy cells to stresses applied in this study, such as low nitrogen or glucose or raised temperature. These cells are able to respond via interconnected signaling pathways such as CWI, TORC and SAPK. Activation of these pathways allows the cell to respond to the effects of stress and restore cell homeostasis and integrity. In contrast, cells lacking btn1 are unable to respond to the applied stresses (represented by ‘?’ and ‘X’) and undergo a variety of previously reported responses that include an increase in vacuole size, swollen and disorganized Golgi and mis-trafficking of vacuole enzymes such as carboxypeptidase Y, increased septation index and longer cell cycle and cell length, monopolar growth, defective cell wall, absence of cell rounding (in response to low glucose). Genetic or pharmacological activation of the three signalling pathway provides partial or full rescue of these pleiotropic phenotypes of btn1Δ cells. G, Golgi; Sec, secretory vesicles; V, vacuole; SI, division septum; M, monopolar growth. |
Specifically, the SGA identified negative interactions in tor1, the core kinase component of TORC2, multiple components of the stress-activated protein kinase (SAPK) pathway, and a component of the linked CWI pathway. In addition, tco89, encoding a core component of TORC1, which antagonises both the SAPK cascade and TORC2 signalling, was identified as a positive genetic interactor of btn1. btn1 was also found to interact negatively with a number of genes that display stress-responsive expression.
–
TORC1 negatively regulates a number of processes associated with cellular catabolism and adaptation to stress [24]. One of these roles is in the repression of autophagy. Autophagy similarly appears important to the fitness of btn1Δ cells, as atg14 and atg12 were identified as negative interactors of btn1, and both are required for autophagosome formation [38]. In support of this work, and the use of yeast as a model, defective autophagy has previously been linked to CLN3 disease [39]. In repressing stress-responsive processes, TORC1 is known to negatively regulate sty1, the mitogen-activated protein (MAP) kinase and component of the stress-activated protein kinase (SAPK) cascade [33]. Both wis4 and wis1, encoding the MAP kinase kinase kinase and MAP kinase kinase of the SAPK pathway, respectively, interact negatively with btn1, as does the transcription factor gene pap1, which is a downstream target of sty1 [40]. Furthermore, btn1 interacts negatively with a number of genes that display stress-responsive expression.
–
TORC2 is a positive regulator of stress-responsive processes [29], and is also involved in cytoskeletal organization, vacuolar morphology and glucose sensing [22]. In addition to a negative interaction with the gene encoding the Tor kinase component of TORC2 (tor1), btn1 also negatively interacts with genes encoding components of the connected CWI MAP kinase cascade. The relationship between TORC2 and the CWI pathway is complex. TORC2 is required for the response to cell wall stressors [41], and is a direct regulator of the CWI pathway through the activation of the Rho guanine-nucleotide exchange factor (GEF) ROM2 in budding yeast [42]. In fission yeast, it has recently been shown that Tor1, acting as part of TORC2, enhances Pck2 synthesis to activate the CWI under both cell wall stress and glucose limitation conditions [43].
–
Despite this positive relationship, recent work in fission yeast has indicated a negative regulation of TORC2 by pmk1, the MAP kinase component of the fission yeast CWI pathway, at least in certain conditions [25]. In fission yeast both Rho1 and Rho2 are well established as regulators of the CWI pathway [44][45]. Rho5 acts as a functional homologue of rho1, sharing the role of regulating cell wall homeostasis [46]. More recently, rho5 has also been shown to be an upstream regulator of the CWI [47]. The regulation of this pathway is complex as Rho1 both positively [45] and negatively [48] regulates the downstream MAP kinase cascade. This potentially intricate relationship is reflected in the interactors of btn1 that fall within this pathway, that exhibit both positive and negative effects upon signalling. btn1 exhibits a negative interaction with the rho1 homologue gene rho5, and a number of genes involved in downstream cytoskeletal and polarity components. Despite this, the Rho GEF gene rgf1, which is a positive regulator of the CWI pathway [49], is a positive interactor of btn1 whereas rdi1 (encoding a GDP dissociation factor) is a negative interactor. This multifaceted pattern of interactions is consistent with current understanding of this pathway, given the complex interactions between these signalling nodes.
–
Although a process that maintains CWI might seem fungal-specific, and not relevant to disease in a higher eukaryote, previous work in budding yeast revealed similar dysfunctional processes in cells overexpressing α-synuclein as a model for Parkinson’s disease, suggesting that there is a mammalian counterpart to the CWI pathway in yeast. Such observations are of specific relevance to CLN3 disease, as α-synuclein is also upregulated in this condition [9]. RHO1 signalling and the CWI pathway are disrupted by overexpression of α-synuclein [50]. Further, it was demonstrated that similar changes in downstream kinase cascades could be observed in mammalian cells overexpressing α-synuclein. Affected kinases included c-Jun, which has previously been linked to CLN3 disease, and is part of a pathway closely related to the SAPK pathway in yeast [51]. This is not the only instance in which Rho signalling has been linked to neurodegeneration. Leucine-rich repeat kinase 2 (LRRK2), mutations in which represent the most common cause of familial late-onset Parkinson’s disease, has been shown to bind Rac1, and to a lesser extent RhoA and Cdc42 [52]. All of these binding partners are members of the Rho GTPase family. The binding of LRRK2 to Rac1 led to its activation and relocalisation, and was lost when disease-causing mutations were introduced into LRRK2. Further, the overexpression of Rac1 was shown to be protective in these cells. Other studies have also demonstrated a protective effect of Rho signalling, focusing both on Rho GEFs [53] and the Rho GTPases themselves [54]. Such studies highlight how processes as seemingly specialized as CWI in yeast can be highly informative of processes relevant to disease in higher order eukaryotes. Further, they demonstrate that Rho-dependent signalling could be a vital neuroprotective process in more common neurodegenerative disease, as well as being a key pathway in the neurodegenerative disease model presented in this study.
–
Importantly, the validation of these interactions during this work revealed interventions that produced a complete rescue of all phenotypes investigated in the btn1Δ strain, including phenotypes linked to TORC1 function, TORC2 function, CWI and vacuole homeostasis. Among the interactions investigated, increasing Rho1 levels, and thereby upregulating the main signalling node in the CWI pathway, or repressing TORC1 function (pharmacologically or genetically) led to complete rescues.
–
More notably, a neuroprotective role of TORC1 repression is already well established in a number of different systems [55]. A protective effect of the TORC1 antagonist rapamycin has been demonstrated in models for Parkinson’s disease [56], Huntington’s disease [57], spinoceribellar ataxia type 3 [58] and retinal degeneration mediated by mitochondrial dysfunction [59]. In addition, Tor signalling is also elevated in Alzheimer’s disease models [60].
–
It is important to note, however, that targeting TORC1 in disease presents some technical challenges. Although in some studies an increase in lysosome function has been observed upon rapamycin treatment [61], other work indicates that rapamycin is an incomplete antagonist of TORC1 and a poor inducer of lysosomal functions [62], in concert with our observations. Another complication of targeting TORC1 in disease is the antagonistic role of TORC2. TORC2 signalling and the connected CWI pathway were both protective in our model for CLN3 disease. Further to the protective role of Rho signalling in a Parkinson’s disease model [50], TORC2/AKT signalling has also been shown to be neuroprotective in a separate study of Parkinson’s disease [63]. As a result, general Tor antagonists, such as Torin1, which target both TORC1 and TORC2, do not produce the same positive outcomes that TORC1 specific antagonists are able to elicit [56]. In addition, chronic rapamycin exposure also leads to a reduction in TORC2 activity. This fact could explain why rapamycin has been shown to be detrimental in certain studies, for example in one study using a fruit fly model for Alzheimer’s disease [64].
–
Conclusion
The data presented here highlight a set of interconnected pathways that, when modulated correctly, produce a profound rescue of the dysfunctional changes observed in a yeast model for neurodegeneration caused by mutations in a single gene (Fig. 7). Links between CLN3 and the response to stress have previously been reported in other model organisms [51][65], supporting the relevance of this yeast work to human CLN3 disease. Importantly however, a link between CLN3 and Tor signalling specifically, as reported here, is a novel mechanistic and therapeutic insight into CLN3 disease, the most common paediatric neurodegenerative disease. Furthermore, the pathways identified display strong parallels with known protective pathways in more common dementias, providing not only strong biological plausibility for the importance of these interactions, but also an indication that common processes may be exploited in therapeutic development for seemingly disparate neurodegenerative diseases.
MATERIALS AND METHODS
Yeast strains and cell growth
The strains used in this study were the wild-type strains SP23 (h–, ura4-D18, leu1-32, ade6-M210) and SP38 (h–, ura4-D18, leu1-32, ade6-210, his-) and btn1Δ strains SP29 (h-, btn1::NatMX, ura4-D18, leu1-32, ade6-210,) and SP35 (h-, btn1::NatMX, ura4-D18, leu1-32, ade6-210, his-). SP29 and SP35 were generated using the long primer method described in [66], using pFA6a-NatMX as a template [67]. Both strain backgrounds were used for SGA analysis (two isolates of each) to account for strain background differences, and SP23 and SP29 were used in all other analyses. Cell growth and manipulations were performed as described previously [68]. Minimal media (MM) was used in all experiments, unless otherwise stated. In nitrogen starvation experiments NH4Cl was omitted. Glucose and glycerol media were made as described previously [69]. Appropriate supplements were added to the media as required. All assays were performed using log-phase cultures (1 x 10⁶ cells/ml). The dnrhb1 construct (pREP4X-rhb1D60K) was obtained from Dr. Elizabeth Henske [34], and the gad8 construct (pREP41-gad8) from Dr. Ronit Weisman [70]. pREP1-rho5 was obtained from Dr. Kentaro Nakano [46], pREP41-rho1 from Dr. Pilar Pérez [48] and pREP1-wis1DD-3HA6His from Dr. Kaz Shiozaki [71]. The GFP-btn1 construct used in this study was described previously (pREP41-GFP-btn1) [12]. SP23 containing empty vector (pREP41) was used as a control in all experiments using these constructs.
–
Synthetic genetic arrays (SGAs)
SGA analysis was performed as described in [20], using a Singer RoToR robot (S. pombe settings) and the Bioneer haploid library (v2.0) and analysed as described previously [72]. A control SGA using ade6::NatMX4 as a query was performed simultaneously. The ade6Δ mutant does not alter the fitness of the deletion collection, and arising double mutants are used to determine Bioneer strain fitness and for colony size normalisation. After germination, haploid double mutants were pinned to YES + G418 + Nat in a 1536 format. After three days growth at 30°C, agar plates were imaged using a MultiDoc-It Imaging System (UVP) and processed for analysis using the Gitter image analysis R package [73]. Using Excel, the colony sizes produced by Gitter were normalized to the median colony size of each plate to account for within-plate positional growth effects and differential plate growth. These normalized values were used to establish the ratio of query btn1Δ mutant size to control (ade6:NatMX4) colony size. Ratios from the four btn1Δ isolates used for the screen were used to calculate a mean ratio. Using this mean value, colony-size ratio scores of < 0.8 were defined as negative interactions, and ratios of > 1.2 as positive interactions. Genetic interactions were scored from two independent biological experiments. Only interactions common to both replicates were considered robust enough for follow-up. Negative and positive interaction sets were tested using PANTHER [74].
–
Microscopy
All images were obtained using a Leica SPE2 true scanning confocal microscope with 63 x 1.4 NA oil immersion objective. Images were recorded using Leica AF software. Calcofluor-white (Sigma-Aldrich) staining was performed as described previously [68]. Calcofluor-white was used to allow cell segmentation for assays of cell morphology. For assays of cell viability, propidium iodide (Sigma-Aldrich) was added to the cells (15 μg/ml final concentration) at the same point as the calcofluor-white. Staining was performed in a volume of 1 ml, allowed to proceed at room temperature for 10 min, and the cells were washed twice in MM before visualisation. No cell fixation was applied. The vital dye FM4-64 (Molecular Probes) was used to visualise vacuolar morphology. The staining procedure has been described previously [12].
–
Image analysis
All microscopy image analysis was performed using ImageJ software. For analysis of cell morphology, cells were segmented using the BOA plugin of the quantitative imaging of membrane proteins (Quimp) package [75]. Cell elongation was then determined using the equation: (1-(4π*area/perimeter2)). Thirty cells were counted per dataset.
–
Statistical analysis
All statistical analysis was performed using Prism software, version 6.0C (Graphpad). In instances where only two samples were compared, significance was determined using an unpaired t test. In instances where multiple columns were compared, an ordinary one-way ANOVA was used with a Tukey’s multiple-comparison post-test. All error bars represent mean ± standard error of the mean (SEM). In all cases, the statistical test used, p-values and the number of samples analysed are highlighted in the figure legend for clarity.
References
- A. Jalanko, and T. Braulke, "Neuronal ceroid lipofuscinoses", Biochimica et Biophysica Acta (BBA) - Molecular Cell Research, vol. 1793, pp. 697-709, 2009. http://dx.doi.org/10.1016/j.bbamcr.2008.11.004
- R.E. Williams, and S.E. Mole, "New nomenclature and classification scheme for the neuronal ceroid lipofuscinoses", Neurology, vol. 79, pp. 183-191, 2012. http://dx.doi.org/10.1212/WNL.0b013e31825f0547
- R.A. Nixon, D. Yang, and J. Lee, "Neurodegenerative lysosomal disorders: a continuum from development to late age.", Autophagy, 2008. http://www.ncbi.nlm.nih.gov/pubmed/18497567
- U.T. Brunk, and A. Terman, "The mitochondrial‐lysosomal axis theory of aging", European Journal of Biochemistry, vol. 269, pp. 1996-2002, 2002. http://dx.doi.org/10.1046/j.1432-1033.2002.02869.x
- A.A. Golabek, E. Kida, M. Walus, W. Kaczmarski, M. Michalewski, and K.E. Wisniewski, "CLN3 Protein Regulates Lysosomal pH and Alters Intracellular Processing of Alzheimer's Amyloid-β Protein Precursor and Cathepsin D in Human Cells", Molecular Genetics and Metabolism, vol. 70, pp. 203-213, 2000. http://dx.doi.org/10.1006/mgme.2000.3006
- J.M. Holopainen, J. Saarikoski, P.K.J. Kinnunen, and I. Järvelä, "Elevated lysosomal pH in neuronal ceroid lipofuscinoses (NCLs)", European Journal of Biochemistry, vol. 268, pp. 5851-5856, 2001. http://dx.doi.org/10.1046/j.0014-2956.2001.02530.x
- K. Luiro, O. Kopra, T. Blom, M. Gentile, H.M. Mitchison, I. Hovatta, K. Törnquist, and A. Jalanko, "Batten disease (JNCL) is linked to disturbances in mitochondrial, cytoskeletal, and synaptic compartments", Journal of Neuroscience Research, vol. 84, pp. 1124-1138, 2006. http://dx.doi.org/10.1002/jnr.21015
- G.G. Glenner, "Alzheimer's disease: Its proteins and genes", Cell, vol. 52, pp. 307-308, 1988. http://dx.doi.org/10.1016/S0092-8674(88)80021-7
- S. Kang, T. Heo, and S. Kim, "Altered levels of α-synuclein and sphingolipids in Batten disease lymphoblast cells", Gene, vol. 539, pp. 181-185, 2014. http://dx.doi.org/10.1016/j.gene.2014.02.017
- R. Nussbaum, "Genetics of Parkinson's disease", Human Molecular Genetics, vol. 6, pp. 1687-1691, 1997. http://dx.doi.org/10.1093/hmg/6.10.1687
- M. Bond, S.K. Holthaus, I. Tammen, G. Tear, and C. Russell, "Use of model organisms for the study of neuronal ceroid lipofuscinosis", Biochimica et Biophysica Acta (BBA) - Molecular Basis of Disease, vol. 1832, pp. 1842-1865, 2013. http://dx.doi.org/10.1016/j.bbadis.2013.01.009
- Y. Gachet, S. Codlin, J.S. Hyams, and S.E. Mole, "btn1, theSchizosaccharomyces pombehomologue of the human Batten disease geneCLN3, regulates vacuole homeostasis", Journal of Cell Science, vol. 118, pp. 5525-5536, 2005. http://dx.doi.org/10.1242/jcs.02656
- S. Codlin, and S.E. Mole, "S. pombe btn1, the orthologue of the Batten disease geneCLN3, is required for vacuole protein sorting of Cpy1p and Golgi exit of Vps10p", Journal of Cell Science, vol. 122, pp. 1163-1173, 2009. http://dx.doi.org/10.1242/jcs.038323
- C. Kitzmuller, R.L. Haines, S. Codlin, D.F. Cutler, and S.E. Mole, "A function retained by the common mutant CLN3 protein is responsible for the late onset of juvenile neuronal ceroid lipofuscinosis", Human Molecular Genetics, vol. 17, pp. 303-312, 2007. http://dx.doi.org/10.1093/hmg/ddm306
- S. Codlin, R.L. Haines, and S.E. Mole, "btn1 Affects Endocytosis, Polarization of Sterol‐Rich Membrane Domains and Polarized Growth in Schizosaccharomyces pombe", Traffic, vol. 9, pp. 936-950, 2008. http://dx.doi.org/10.1111/J.1600-0854.2008.00735.X
- S. Codlin, R.L. Haines, J. Jemima, E. Burden, and S.E. Mole, "btn1affects cytokinesis and cell-wall deposition by independent mechanisms, one of which is linked to dysregulation of vacuole pH", Journal of Cell Science, vol. 121, pp. 2860-2870, 2008. http://dx.doi.org/10.1242/Jcs.030122
- M.R. Pears, S. Codlin, R.L. Haines, I.J. White, R.J. Mortishire-Smith, S.E. Mole, and J.L. Griffin, "Deletion of btn1, an orthologue of CLN3, increases glycolysis and perturbs amino acid metabolism in the fission yeast model of Batten disease", Molecular BioSystems, vol. 6, pp. 1093, 2010. http://dx.doi.org/10.1039/b915670d
- K. Luiro, "Interconnections of CLN3, Hook1 and Rab proteins link Batten disease to defects in the endocytic pathway", Human Molecular Genetics, vol. 13, pp. 3017-3027, 2004. http://dx.doi.org/10.1093/hmg/ddh321
- D.J. Metcalf, A.A. Calvi, M.N. Seaman, H.M. Mitchison, and D.F. Cutler, "Loss of the Batten Disease Gene CLN3 Prevents Exit from the TGN of the Mannose 6‐Phosphate Receptor", Traffic, vol. 9, pp. 1905-1914, 2008. http://dx.doi.org/10.1111/j.1600-0854.2008.00807.x
- A. Baryshnikova, M. Costanzo, S. Dixon, F.J. Vizeacoumar, C.L. Myers, B. Andrews, and C. Boone, "Synthetic Genetic Array (SGA) Analysis in Saccharomyces cerevisiae and Schizosaccharomyces pombe", Methods in Enzymology, pp. 145-179, 2010. http://dx.doi.org/10.1016/S0076-6879(10)70007-0
- S. Willingham, T.F. Outeiro, M.J. DeVit, S.L. Lindquist, and P.J. Muchowski, "Yeast Genes That Enhance the Toxicity of a Mutant Huntingtin Fragment or α-Synuclein", Science, vol. 302, pp. 1769-1772, 2003. http://dx.doi.org/10.1126/science.1090389
- N. Ikai, N. Nakazawa, T. Hayashi, and M. Yanagida, "The reverse, but coordinated, roles of Tor2 (TORC1) and Tor1 (TORC2) kinases for growth, cell cycle and separase-mediated mitosis inSchizosaccharomyces pombe", Open Biology, vol. 1, pp. 110007, 2011. http://dx.doi.org/10.1098/rsob.110007
- R. Weisman, I. Roitburg, M. Schonbrun, R. Harari, and M. Kupiec, "Opposite Effects of Tor1 and Tor2 on Nitrogen Starvation Responses in Fission Yeast", Genetics, vol. 175, pp. 1153-1162, 2007. http://dx.doi.org/10.1534/genetics.106.064170
- T. Matsuo, Y. Otsubo, J. Urano, F. Tamanoi, and M. Yamamoto, "Loss of the TOR Kinase Tor2 Mimics Nitrogen Starvation and Activates the Sexual Development Pathway in Fission Yeast", Molecular and Cellular Biology, vol. 27, pp. 3154-3164, 2007. http://dx.doi.org/10.1128/MCB.01039-06
- A. Cohen, M. Kupiec, and R. Weisman, "Glucose Activates TORC2-Gad8 Protein via Positive Regulation of the cAMP/cAMP-dependent Protein Kinase A (PKA) Pathway and Negative Regulation of the Pmk1 Protein-Mitogen-activated Protein Kinase Pathway", Journal of Biological Chemistry, vol. 289, pp. 21727-21737, 2014. http://dx.doi.org/10.1074/jbc.M114.573824
- K. Ikeda, S. Morigasaki, H. Tatebe, F. Tamanoi, and K. Shiozaki, "Fission yeast TOR complex 2 activates the AGC-family Gad8 kinase essential for stress resistance and cell cycle control", Cell Cycle, vol. 7, pp. 358-364, 2008. http://dx.doi.org/10.4161/cc.7.3.5245
- Y. Hanyu, K.K. Imai, Y. Kawasaki, T. Nakamura, Y. Nakaseko, K. Nagao, A. Kokubu, M. Ebe, A. Fujisawa, T. Hayashi, C. Obuse, and M. Yanagida, "Schizosaccharomyces pombe cell division cycle under limited glucose requires Ssp1 kinase, the putative CaMKK, and Sds23, a PP2A‐related phosphatase inhibitor", Genes to Cells, vol. 14, pp. 539-554, 2009. http://dx.doi.org/10.1111/j.1365-2443.2009.01290.x
- D.E. Levin, "Cell Wall Integrity Signaling inSaccharomyces cerevisiae", Microbiology and Molecular Biology Reviews, vol. 69, pp. 262-291, 2005. http://dx.doi.org/10.1128/MMBR.69.2.262-291.2005
- T. Matsuo, "Schizosaccharomyces pombe AGC family kinase Gad8p forms a conserved signaling module with TOR and PDK1-like kinases", The EMBO Journal, vol. 22, pp. 3073-3083, 2003. http://dx.doi.org/10.1093/emboj/cdg298
- M. Madrid, J. Fernández-Zapata, L. Sánchez-Mir, T. Soto, A. Franco, J. Vicente-Soler, M. Gacto, and J. Cansado, "Role of the fission yeast cell integrity MAPK pathway in response to glucose limitation", BMC Microbiology, vol. 13, pp. 34, 2013. http://dx.doi.org/10.1186/1471-2180-13-34
- R. Sugiura, "pmp1+, a suppressor of calcineurin deficiency, encodes a novel MAP kinase phosphatase in fission yeast", The EMBO Journal, vol. 17, pp. 140-148, 1998. http://dx.doi.org/10.1093/emboj/17.1.140
- T. Mutoh, K. Nakano, and I. Mabuchi, "Rho1‐GEFs Rgf1 and Rgf2 are involved in formation of cell wall and septum, while Rgf3 is involved in cytokinesis in fission yeast", Genes to Cells, vol. 10, pp. 1189-1202, 2005. http://dx.doi.org/10.1111/j.1365-2443.2005.00908.x
- S. Hartmuth, and J. Petersen, "Fission yeast Tor1 functions as part of TORC1 to control mitotic entry through the stress MAPK pathway following nutrient stress", Journal of Cell Science, vol. 122, pp. 1737-1746, 2009. http://dx.doi.org/10.1242/jcs.049387
- M. van Slegtenhorst, E. Carr, R. Stoyanova, W.D. Kruger, and E.P. Henske, "Tsc1+ and tsc2+ Regulate Arginine Uptake and Metabolism in Schizosaccharomyces pombe", Journal of Biological Chemistry, vol. 279, pp. 12706-12713, 2004. http://dx.doi.org/10.1074/jbc.M313874200
-
C. Rallis, S. Codlin, and J. Bähler, "
TORC 1 signaling inhibition by rapamycin and caffeine affect lifespan, global gene expression, and cell proliferation of fission yeast", Aging Cell, vol. 12, pp. 563-573, 2013. http://dx.doi.org/10.1111/acel.12080 - A. Nakashima, T. Sato, and F. Tamanoi, "Fission yeast TORC1 regulates phosphorylation of ribosomal S6 proteins in response to nutrients and its activity is inhibited by rapamycin", Journal of Cell Science, vol. 123, pp. 777-786, 2010. http://dx.doi.org/10.1242/jcs.060319
- A.N. Nguyen, and K. Shiozaki, "Heat-shock-induced activation of stress MAP kinase is regulated by threonine- and tyrosine-specific phosphatases.", Genes & development, 1999. http://www.ncbi.nlm.nih.gov/pubmed/10398679
- H. Mukaiyama, M. Nakase, T. Nakamura, Y. Kakinuma, and K. Takegawa, "Autophagy in the fission yeast Schizosaccharomyces pombe", FEBS Letters, vol. 584, pp. 1327-1334, 2009. http://dx.doi.org/10.1016/j.febslet.2009.12.037
- U. Chandrachud, M.W. Walker, A.M. Simas, S. Heetveld, A. Petcherski, M. Klein, H. Oh, P. Wolf, W. Zhao, S. Norton, S.J. Haggarty, E. Lloyd-Evans, and S.L. Cotman, "Unbiased Cell-based Screening in a Neuronal Cell Model of Batten Disease Highlights an Interaction between Ca2+ Homeostasis, Autophagy, and CLN3 Protein Function", Journal of Biological Chemistry, vol. 290, pp. 14361-14380, 2015. http://dx.doi.org/10.1074/jbc.M114.621706
- W.M. Toone, S. Kuge, M. Samuels, B.A. Morgan, T. Toda, and N. Jones, "Regulation of the fission yeast transcription factor Pap1 by oxidative stress: requirement for the nuclear export factor Crm1 (Exportin) and the stress-activated MAP kinase Sty1/Spc1", Genes & Development, vol. 12, pp. 1453-1463, 1998. http://dx.doi.org/10.1101/gad.12.10.1453
- L. Hálová, W. Du, S. Kirkham, D.L. Smith, and J. Petersen, "Phosphorylation of the TOR ATP binding domain by AGC kinase constitutes a novel mode of TOR inhibition", Journal of Cell Biology, vol. 203, pp. 595-604, 2013. http://dx.doi.org/10.1083/jcb.201305103
- A. Schmidt, M. Bickle, T. Beck, and M.N. Hall, "The Yeast Phosphatidylinositol Kinase Homolog TOR2 Activates RHO1 and RHO2 via the Exchange Factor ROM2", Cell, vol. 88, pp. 531-542, 1997. http://dx.doi.org/10.1016/S0092-8674(00)81893-0
- M. Madrid, R. Jiménez, L. Sánchez-Mir, T. Soto, A. Franco, J. Vicente-Soler, M. Gacto, P. Pérez, and J. Cansado, "Multiple regulatory levels influence cell integrity control by PKC ortholog Pck2 in fission yeast", Journal of Cell Science, 2014. http://dx.doi.org/10.1242/jcs.158295
- L. Sánchez-Mir, A. Franco, R. Martín-García, M. Madrid, J. Vicente-Soler, T. Soto, M. Gacto, P. Pérez, and J. Cansado, "Rho2 Palmitoylation Is Required for Plasma Membrane Localization and Proper Signaling to the Fission Yeast Cell Integrity Mitogen-Activated Protein Kinase Pathway", Molecular and Cellular Biology, vol. 34, pp. 2745-2759, 2014. http://dx.doi.org/10.1128/MCB.01515-13
- L. Sánchez-Mir, T. Soto, A. Franco, M. Madrid, R.A. Viana, J. Vicente, M. Gacto, P. Pérez, and J. Cansado, "Rho1 GTPase and PKC Ortholog Pck1 Are Upstream Activators of the Cell Integrity MAPK Pathway in Fission Yeast", PLoS ONE, vol. 9, pp. e88020, 2014. http://dx.doi.org/10.1371/journal.pone.0088020
- K. Nakano, R. Arai, and I. Mabuchi, "Small GTPase Rho5 is a functional homologue of Rho1, which controls cell shape and septation in fission yeast", FEBS Letters, vol. 579, pp. 5181-5186, 2005. http://dx.doi.org/10.1016/j.febslet.2005.08.031
-
A. Doi, A. Kita, Y. Kanda, T. Uno, K. Asami, R. Satoh, K. Nakano, and R. Sugiura, "Geranylgeranyltransferase
C wg2‐Rho4/Rho5 module is implicated in theP mk1MAP kinase‐mediated cell wall integrity pathway in fission yeast", Genes to Cells, vol. 20, pp. 310-323, 2015. http://dx.doi.org/10.1111/gtc.12222 - R.A. Viana, M. Pinar, T. Soto, P.M. Coll, J. Cansado, and P. Pérez, "Negative Functional Interaction Between Cell Integrity MAPK Pathway and Rho1 GTPase in Fission Yeast", Genetics, vol. 195, pp. 421-432, 2013. http://dx.doi.org/10.1534/genetics.113.154807
- P. Garcia, V. Tajadura, and Y. Sanchez, "The Rho1p Exchange Factor Rgf1p Signals Upstream from the Pmk1 Mitogen-activated Protein Kinase Pathway in Fission Yeast", Molecular Biology of the Cell, vol. 20, pp. 721-731, 2009. http://dx.doi.org/10.1091/mbc.E08-07-0673
- S. Wang, B. Xu, L. Liou, Q. Ren, S. Huang, Y. Luo, Z. Zhang, and S.N. Witt, "α-Synuclein disrupts stress signaling by inhibiting polo-like kinase Cdc5/Plk2", Proceedings of the National Academy of Sciences, vol. 109, pp. 16119-16124, 2012. http://dx.doi.org/10.1073/pnas.1206286109
- R.I. Tuxworth, V. Vivancos, M.B. O'Hare, and G. Tear, "Interactions between the juvenile Batten disease gene, CLN3, and the Notch and JNK signalling pathways", Human Molecular Genetics, vol. 18, pp. 667-678, 2008. http://dx.doi.org/10.1093/hmg/ddn396
- D. Chan, A. Citro, J.M. Cordy, G.C. Shen, and B. Wolozin, "Rac1 Protein Rescues Neurite Retraction Caused by G2019S Leucine-rich Repeat Kinase 2 (LRRK2)", Journal of Biological Chemistry, vol. 286, pp. 16140-16149, 2011. http://dx.doi.org/10.1074/jbc.M111.234005
- K. Namekata, C. Harada, C. Taya, X. Guo, H. Kimura, L.F. Parada, and T. Harada, "Dock3 induces axonal outgrowth by stimulating membrane recruitment of the WAVE complex", Proceedings of the National Academy of Sciences, vol. 107, pp. 7586-7591, 2010. http://dx.doi.org/10.1073/pnas.0914514107
- E. Mocholí, B. Ballester-Lurbe, G. Arqué, E. Poch, B. Peris, C. Guerri, M. Dierssen, R.M. Guasch, J. Terrado, and I. Pérez-Roger, "RhoE Deficiency Produces Postnatal Lethality, Profound Motor Deficits and Neurodevelopmental Delay in Mice", PLoS ONE, vol. 6, pp. e19236, 2011. http://dx.doi.org/10.1371/journal.pone.0019236
- J. Bové, M. Martínez-Vicente, and M. Vila, "Fighting neurodegeneration with rapamycin: mechanistic insights", Nature Reviews Neuroscience, vol. 12, pp. 437-452, 2011. http://dx.doi.org/10.1038/nrn3068
- C. Malagelada, Z.H. Jin, V. Jackson-Lewis, S. Przedborski, and L.A. Greene, "Rapamycin Protects against Neuron Death inIn VitroandIn VivoModels of Parkinson's Disease", The Journal of Neuroscience, vol. 30, pp. 1166-1175, 2010. http://dx.doi.org/10.1523/JNEUROSCI.3944-09.2010
- S. Sarkar, B. Ravikumar, R.A. Floto, and D.C. Rubinsztein, "Rapamycin and mTOR-independent autophagy inducers ameliorate toxicity of polyglutamine-expanded huntingtin and related proteinopathies", Cell Death & Differentiation, vol. 16, pp. 46-56, 2008. http://dx.doi.org/10.1038/cdd.2008.110
- F.M. Menzies, J. Huebener, M. Renna, M. Bonin, O. Riess, and D.C. Rubinsztein, "Autophagy induction reduces mutant ataxin-3 levels and toxicity in a mouse model of spinocerebellar ataxia type 3", Brain, vol. 133, pp. 93-104, 2009. http://dx.doi.org/10.1093/brain/awp292
- C. Zhao, D. Yasumura, X. Li, M. Matthes, M. Lloyd, G. Nielsen, K. Ahern, M. Snyder, D. Bok, J.L. Dunaief, M.M. LaVail, and D. Vollrath, "mTOR-mediated dedifferentiation of the retinal pigment epithelium initiates photoreceptor degeneration in mice", Journal of Clinical Investigation, vol. 121, pp. 369-383, 2011. http://dx.doi.org/10.1172/JCI44303
- A. Caccamo, M.A. Maldonado, S. Majumder, D.X. Medina, W. Holbein, A. Magrí, and S. Oddo, "Naturally Secreted Amyloid-β Increases Mammalian Target of Rapamycin (mTOR) Activity via a PRAS40-mediated Mechanism", Journal of Biological Chemistry, vol. 286, pp. 8924-8932, 2011. http://dx.doi.org/10.1074/jbc.M110.180638
- B. Dehay, J. Bové, N. Rodríguez-Muela, C. Perier, A. Recasens, P. Boya, and M. Vila, "Pathogenic Lysosomal Depletion in Parkinson's Disease", The Journal of Neuroscience, vol. 30, pp. 12535-12544, 2010. http://dx.doi.org/10.1523/JNEUROSCI.1920-10.2010
- J. Zhou, S. Tan, V. Nicolas, C. Bauvy, N. Yang, J. Zhang, Y. Xue, P. Codogno, and H. Shen, "Activation of lysosomal function in the course of autophagy via mTORC1 suppression and autophagosome-lysosome fusion", Cell Research, vol. 23, pp. 508-523, 2013. http://dx.doi.org/10.1038/cr.2013.11
- V. Ries, C. Henchcliffe, T. Kareva, M. Rzhetskaya, R. Bland, M.J. During, N. Kholodilov, and R.E. Burke, "Oncoprotein Akt/PKB induces trophic effects in murine models of Parkinson's disease", Proceedings of the National Academy of Sciences, vol. 103, pp. 18757-18762, 2006. http://dx.doi.org/10.1073/pnas.0606401103
- D. Ling, H. Song, D. Garza, T.P. Neufeld, and P.M. Salvaterra, "Abeta42-Induced Neurodegeneration via an Age-Dependent Autophagic-Lysosomal Injury in Drosophila", PLoS ONE, vol. 4, pp. e4201, 2009. http://dx.doi.org/10.1371/journal.pone.0004201
- R.I. Tuxworth, H. Chen, V. Vivancos, N. Carvajal, X. Huang, and G. Tear, "The Batten disease gene CLN3 is required for the response to oxidative stress", Human Molecular Genetics, vol. 20, pp. 2037-2047, 2011. http://dx.doi.org/10.1093/hmg/ddr088
- J. Bähler, J.Q. Wu, M.S. Longtine, N.G. Shah, A. McKenzie, A.B. Steever, A. Wach, P. Philippsen, and J.R. Pringle, "Heterologous modules for efficient and versatile PCR-based gene targeting in Schizosaccharomyces pombe.", Yeast (Chichester, England), 1998. http://www.ncbi.nlm.nih.gov/pubmed/9717240
- M. Sato, S. Dhut, and T. Toda, "New drug‐resistant cassettes for gene disruption and epitope tagging in Schizosaccharomyces pombe", Yeast, vol. 22, pp. 583-591, 2005. http://dx.doi.org/10.1002/yea.1233
- S. Moreno, A. Klar, and P. Nurse, "Molecular genetic analysis of fission yeast Schizosaccharomyces pombe.", Methods in enzymology, 1991. http://www.ncbi.nlm.nih.gov/pubmed/2005825
- J. Rorbach, R. Richter, H.J. Wessels, M. Wydro, M. Pekalski, M. Farhoud, I. Kühl, M. Gaisne, N. Bonnefoy, J.A. Smeitink, R.N. Lightowlers, and Z.M. Chrzanowska-Lightowlers, "The human mitochondrial ribosome recycling factor is essential for cell viability", Nucleic Acids Research, vol. 36, pp. 5787-5799, 2008. http://dx.doi.org/10.1093/nar/gkn576
- M. Schonbrun, D. Laor, L. López-Maury, J. Bähler, M. Kupiec, and R. Weisman, "TOR Complex 2 Controls Gene Silencing, Telomere Length Maintenance, and Survival under DNA-Damaging Conditions", Molecular and Cellular Biology, vol. 29, pp. 4584-4594, 2009. http://dx.doi.org/10.1128/MCB.01879-08
- H. Tatebe, and K. Shiozaki, "Identification of Cdc37 as a Novel Regulator of the Stress-Responsive Mitogen-Activated Protein Kinase", Molecular and Cellular Biology, vol. 23, pp. 5132-5142, 2003. http://dx.doi.org/10.1128/MCB.23.15.5132-5142.2003
- C. Rallis, L. López-Maury, T. Georgescu, V. Pancaldi, and J. Bähler, "Systematic screen for mutants resistant to TORC1 inhibition in fission yeast reveals genes involved in cellular ageing and growth", Biology Open, vol. 3, pp. 161-171, 2014. http://dx.doi.org/10.1242/bio.20147245
- O. Wagih, and L. Parts, "gitter: A Robust and Accurate Method for Quantification of Colony Sizes From Plate Images", G3 Genes|Genomes|Genetics, vol. 4, pp. 547-552, 2014. http://dx.doi.org/10.1534/g3.113.009431
- H. Mi, A. Muruganujan, and P.D. Thomas, "PANTHER in 2013: modeling the evolution of gene function, and other gene attributes, in the context of phylogenetic trees", Nucleic Acids Research, vol. 41, pp. D377-D386, 2012. http://dx.doi.org/10.1093/nar/gks1118
- L. Bosgraaf, P.J. van Haastert, and T. Bretschneider, "Analysis of cell movement by simultaneous quantification of local membrane displacement and fluorescent intensities using Quimp2", Cell Motility, vol. 66, pp. 156-165, 2009. http://dx.doi.org/10.1002/cm.20338
SUPPLEMENTAL INFORMATION
 Download Supplemental Information
ACKNOWLEDGMENTS
We would like to thank Dr. Elizabeth Henske, Dr. Ronit Weismann, Prof. Kentaro Nakano, Prof. Pilar Pérez, and Prof. Kaz Shiozaki for generously sharing resources. The research leading to these results (MB, SM) received fund-ing from the European Community’s Seventh Framework Pro-gramme (FP7/2007- 2013) under Grant Agreement N° 281234 (DEMCHILD), with additional funding from the Batten Disease Family Association, UK, and the Children's Batten Disease Foundation, USA. RB is funded by the University College Lon-don (UCL) MRC 4yr Doctoral Training Account in Life and Bio-medical Sciences. Research in the Bähler laboratory (CR, JB) is supported by a BBSRC Research Grant [grant number BB/I012451/1] and a Wellcome Trust Senior Investigator Award [grant number 095598/Z/11/Z].
COPYRIGHT
© 2015

A central role for TOR signalling in a yeast model for juvenile CLN3 disease by Michael E. Bond et al. is licensed under a Creative Commons Attribution 4.0 International License.