
Back to article: Molecular signature of the imprintosome complex at the mating-type locus in fission yeast
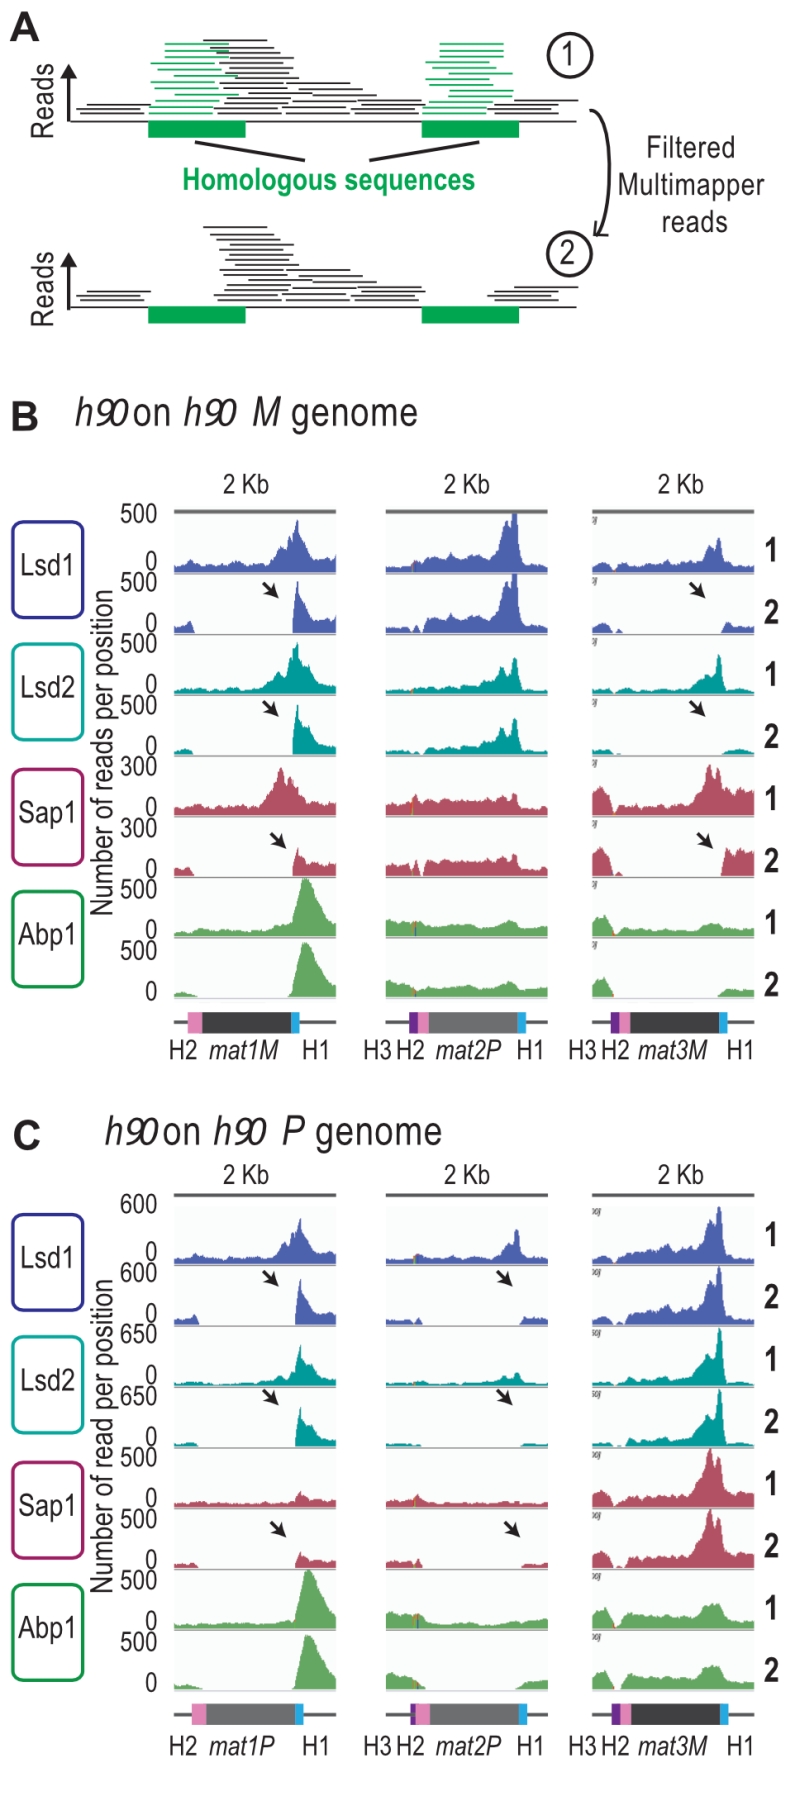
FIGURE 4: Lsd1/2 and Abp1 are recruited only at mat1. (A) Schematic representation of the analysis used. Green boxes represent homologous sequences. Reads that can be unambiguously mapped are represented by black lines and multi-mapper reads are represented by green lines. Upper drawing represents the result of an alignment without filter (1). Lower drawing represents the alignment after that multi-mapper reads are removed using “samtools” algorithm (2). (B) Distribution of raw coverage of the Abp1, Lsd1, Lsd2, and Sap1 ChIPs. The sequence used for the alignment is a 44-kb region that contains the MT region with the M allele at mat1: h90 M. The lines numbered 1 are the coverage without filter and the lines numbered 2 are the coverage obtained after removal of multi-mapper reads. The arrows indicate the unique-mapper reads at the junction of the mat loci. (C) Same as in (B) with the h90 P sequence used for the alignment.