
Back to article: Molecular signature of the imprintosome complex at the mating-type locus in fission yeast
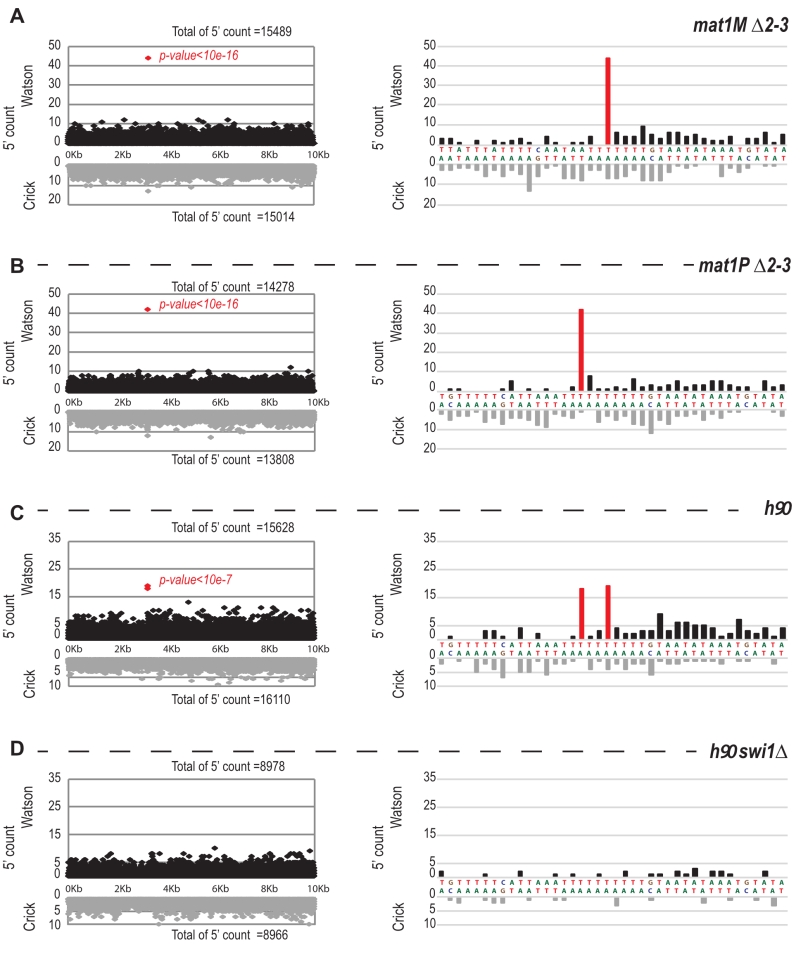
FIGURE 7: 5′ count on the Watson strand is biased precisely at the site of the imprint. On the left: distribution of the 5′ count of the Watson strand (black) and the Crick strand (gray) on the 10-kb region containing mat1. On the right: zoom on the imprint site. Red bars represent the 5′ count enriched at the imprint sites. p-value is calculated using a theoretical t-student distribution that fits on the distribution of the whole-genome observed 5′ count. (A) The sequencing of mat1M ∆2-3 strain is represented, (B) mat1P ∆2-3 strain, (C) h90 strain and (D) h90 swi1∆ strain. ABCD) The mat1M ∆2-3, mat1P ∆2-3 and h90 P genomes are used, respectively.