Research Articles:
Microbial Cell, Vol. 11, No. 1, pp. 328 - 338; doi: 10.15698/mic2024.08.836
Fecal gelatinase does not predict mortality in patients with alcohol-associated hepatitis
1 Department of Medicine, University of California San Diego, La Jolla, CA, 92093, USA. 2 Department of Pediatrics, University of California San Diego, La Jolla, CA, 92093, USA. 3 Division of Gastroenterology, Hepatology & Nutrition, Rady Children’s Hospital San Diego, CA, 92123, San Diego, USA. 4 Department of Medicine, VA San Diego Healthcare System, CA, 92161, San Diego, USA.
Keywords: alcoholic hepatitis, Enterococcus faecalis, microbiota, microbiome.
Received originally: 22/04/2024 Received in revised form: 09/08/2024
Accepted: 13/08/2024
Published: 26/08/2024
Correspondence:
Bernd Schnabl, Tel.: 858-822-5311, Fax: 858-246-1788; beschnabl@ucsd.edu
Conflict of interest statement:
B.S. has been consulting for Ambys Medicines, Ferring Research Institute, Gelesis, HOST Therabiomics, Intercept Pharmaceuticals, Mabwell Therapeutics, Patara Pharmaceuticals, Surrozen and Takeda. B.S. is founder of Nterica Bio. UC San Diego has filed several patents with B.S. as inventor related to this work. B.S.’s institution UC San Diego has received research support from Axial Biotherapeutics, BiomX, ChromoLogic, CymaBay Therapeutics, Intercept Pharmaceuticals, NGM Biopharmaceuticals, Prodigy Biotech and Synlogic Operating Company. P.H.’s institution UC San Diego has received research support from Nterica Bio.
Please cite this article as: Yongqiang Yang, Phillipp Hartmann, Bernd Schnabl (2024). Fecal gelatinase does not predict mortality in patients with alcohol-associated hepatitis. Microbial Cell 11: 328-338. doi: 10.15698/mic2024.08.836
Abstract
Alcohol-associated liver disease is highly prevalent worldwide, with alcohol-associated hepatitis as a severe form characterized by substantial morbidity, mortality, and economic burden. Gut bacterial dysbiosis has been linked to progression of alcohol-associated hepatitis. Fecal cytolysin secreted by the pathobiont Enterococcus faecalis (E. faecalis) is associated with increased mortality in patients with alcohol-associated hepatitis. Although gelatinase is considered a virulence factor in E. faecalis, its prevalence and impact on alcohol- associated hepatitis patient outcomes remains unclear. In this study, 20 out of 65 (30.8%) patients with alcohol-associated hepatitis tested positive for gelatinase in their stool. There were no significant differences in 30-day and 90-day mortality between gelatinase-positive and gelatinase-negative patients (p=0.97 and p=0.48, respectively). Fecal gelatinase had a low discriminative ability for 30-day mortality (area under the curve [AUC] 0.50 vs fibrosis-4 Index (FIB-4) 0.75) and 90-day mortality compared with other established liver disease markers (AUC 0.57 vs FIB- 4 0.79 or ‘age, serum bilirubin, INR, and serum creatinine’ (ABIC) score 0.78). Furthermore, fecal gelatinase was not an important feature for 30-day or 90-day mortality per random forest analysis. Finally, gelatinase-positive patients with alcohol-associated hepatitis did not exhibit more severe liver disease compared with gelatinase-negative patients. In conclusion, fecal gelatinase does not predict mortality or disease severity in patients with alcohol-associated hepatitis from our cohort.
INTRODUCTION
Alcohol-associated liver disease is one of the most common liver diseases worldwide, affecting an estimated 123 million individuals and contributing to approximately 25% of cirrhosis-related deaths 1, 2. Alcohol-associated hepatitis represents a severe form of alcohol-associated liver disease and is associated with the fastest disease progression 3. Alcohol-associated hepatitis is also associated with bacterial infections and the development of acute-on-chronic liver failure, multiorgan failure, culminating in high short-term mortality rates of 20-50% within three months 4. Approximately 60% of hospitalizations due to complications of cirrhosis or acute-on-chronic liver failure were caused by alcohol-associated cirrhosis and alcohol-associated hepatitis 5. There appears to be a growing global incidence of alcohol-associated hepatitis, particularly among young adults and women, incurring a growing health and clinical burden 6. Gut microbial dysbiosis has been associated with the development and progression of chronic liver diseases via the gut-liver axis 7. In particular in alcohol-associated liver disease, various populations of the gut microbiota have been implicated in the pathogenesis and worsening of liver disease 8. Excessive alcohol consumption increases gut permeability by disrupting tight junctions in intestinal epithelial cells and changes the composition of the gut microbiota 9, 10. Furthermore, evidence of bacterial translocation from the gut-colonized niche has been observed in patients with alcohol-associated hepatitis 11. Specifically, we have unveiled that approximately one-third of patients with alcohol-associated hepatitis were colonized with cytolysin-positive Enterococcus faecalis (E. faecalis), which confers more severe liver disease and elevated mortality rates 8.
E. faecalis is a Gram-positive bacterium found in the intestinal tracts of healthy individuals. It also acts as an opportunistic pathogen and is frequently isolated in nosocomial settings 12. E. faecalis has developed the ability to colonize and persist in hospital environments, leading to nosocomial transmission through patient-to-patient contact or via invasive medical devices 13. E. faecalis has been reported to cause hospital outbreaks of bacteremia, urinary tract infections, and endocarditis 14. The estimated annual incidence of E. faecalis bloodstream infections is ~ 4.5 per 100,000, with a case fatality rate ranging between 10 and 20% 15. Ethanol administration facilitates the translocation of gut-originated pathogenic E. faecalis to the liver in mice, exacerbating the progression of liver disease 8. Therefore, exploring the association of pathogenic E. faecalis with the outcomes of patients with alcohol-associated hepatitis is of significant clinical relevance.
Gelatinase is a neutral metalloprotease requiring Ca2+ for activity and plays a role in proteolysis and disruption of basement membranes through collagen degradation 16, 17. In E. faecalis, gelatinase is considered a virulence factor and is associated with biofilm formation 18. Furthermore, gelatinase has been identified as a principal mediator of pathogenesis in endocarditis caused by E. faecalis in animals 16. Gelatinase was prevalent in clinical isolates from patients with bacterial infections, such as endocarditis 19, 20 and bacteremia 20, 21 and fecal isolates 19. Gelatinase has been shown to promote the translocation of E. faecalis in vitro 22. Importantly, colonization with gelE (encodes gelatinase)-positive E. faecalis has been linked to liver carcinogenesis in vivo via the translocation of lipopolysaccharide to the liver and an increase in the expression of proliferative genes 23. Further, it has been shown that the enrichment and translocation of E. faecalis is associated with more severe ethanol-induced liver disease in mice 8, thus, it is likely that the presence of gelatinase in feces could cause more severe alcohol-associated liver disease in patients. This study aims to investigate the significance of fecal gelatinase on clinical outcomes in patients with alcohol-associated hepatitis.
RESULTS
Patient Cohort
The study population consisted of 65 patients with alcohol-associated hepatitis (Table 1). Of these, 60% (39/65) were male, with a median age of 48.5 years and body-mass index (BMI) of 26.9 kg/m2. 19 out of 29 (65.5%) biopsied patients had cirrhosis. The median value of ALT and AST was 49 U/L and 146 U/L, respectively. See additional serum disease markers and scores in Table 1.
TABLE 1. Baseline demographic and laboratory data of the study population.
|
|
n |
Alcohol-associated Hepatitis (n=65) |
|---|---|---|
|
Gender: Male |
65 |
39 (60.0%) |
|
Age [years] |
65 |
48.5 [39.2;57.0] |
|
Body-mass index (BMI) [kg/m2] |
59 |
26.9 [23.8;30.1] |
|
Aspartate aminotransferase (AST) [U/L] |
64 |
146 [90.0;201] |
|
Alanine aminotransferase (ALT) [U/L] |
63 |
49.0 [29.5;66.5] |
|
Gamma-glutamyltransferase (GGT) [U/L] |
38 |
162 [115;562] |
|
Alkaline phosphatase (AP) [U/L] |
63 |
174 [123;250] |
|
Bilirubin [mg/dL] |
64 |
13.9 [8.00;22.2] |
|
Albumin [g/dL] |
63 |
2.50 [2.14;3.00] |
|
International normalized ratio (INR) |
64 |
2.00 [1.60;2.20] |
|
Creatinine [mg/dL] |
64 |
0.76 [0.60;1.10] |
|
White blood count (WBC) [109/L] |
64 |
10.6 [6.36;13.9] |
|
Hemoglobin [g/dL] |
64 |
10.2 [9.10;11.7] |
|
Platelets [109/L] |
63 |
122 [77.5;164] |
|
Dialysis: yes |
49 |
2 (4.08%) |
|
Antibiotics: yes |
64 |
15 (23.4%) |
|
Steroid treatment: yes |
64 |
28 (43.8%) |
|
Child-Pugh Class |
62 |
C [B;C] |
|
Fibrosis-4 Index (FIB-4) |
62 |
6.49 [4.70;13.5] |
|
Maddrey’s DF |
56 |
70.5 [52.9;127] |
|
ABIC |
64 |
8.11 [6.85;8.92] |
|
MELD |
64 |
23.7 [21.8;28.6] |
|
MELD-Na |
64 |
27.0 [24.1;31.4] |
|
Gelatinase: positive |
65 |
20 (30.8%) |
|
Cytolysin: positive |
48 |
12 (25%) |
Values are presented as median and interquartile range in brackets. The number of subjects for which data were available is indicated in the second column. ABIC, ‘Age, serum bilirubin, INR, and serum creatinine score’; Maddrey’s DF, Maddrey’s Discriminant Function; MELD, model for end-stage liver disease; MELD-Na, sodium-adjusted model for end-stage liver disease.
Presence of Fecal Gelatinase does not Predict 30-day and 90-day Mortality in Patients with Alcohol-Associated Hepatitis
Of the total, 30.8% (20/65) patients were positive for gelatinase in their stool samples (Table 1). The contribution of each center for gelatinase-positive and gelatinase-negative patients is shown in Table 2. However, because of the limited number of patients from each country, matching of the area using statistical techniques could not be carried out in a meaningful way. Twelve out of 48 (25%) patients were cytolysin positive, and no difference regarding gelatinase-positivity between the cytolysin-positive and cytolysin-negative groups (33.3% vs. 33.3%) was observed. Six gelatinase-positive and 13 gelatinase-negative patients of the entire population had cirrhosis. For five out of the 65 subjects, no mortality data was available and therefore there were 60 patients remaining to study the association of gelatinase with outcomes. There were no significant differences in 30-day survival and 90-day survival between gelatinase-positive (n=17) and gelatinase-negative patients with alcohol-associated hepatitis (n=43) (Figure 1A, 1B). Overall, seven out of 60 (11.7%) and 16 out of 60 patients with alcohol-associated hepatitis (26.7%) were confirmed dead within 30 and 90 days, respectively. Two out of 17 gelatinase-positive patients (11.8%) and five out of 43 gelatinase-negative patients (11.6%) were confirmed dead within 30 days, whereas three out of 17 gelatinase-positive patients (17.6%) and 13 out of 43 gelatinase-negative patients (30.2%) were confirmed dead within 90 days. We subsequently assessed whether the presence of fecal gelatinase could predict mortality of patients with alcohol-associated hepatitis. In our cohort, fecal gelatinase demonstrated poorer performance in predicting 30-day mortality compared with all other tested liver disease markers (FIB-4, ABIC score, Child-Pugh class, MELD, MELD-Na, and Maddrey’s DF), with a low AUC of 0.50 and low best Youden Index of 0.00 compared to the best performer FIB-4, which exhibited an AUC of 0.75 and best Youden Index of 0.54 (Figure 1C, Table 3). Fecal gelatinase also had a sensitivity of 0.29, specificity of 0.72, accuracy of 0.67, a positive predictive value (PPV) of 0.12, and negative predictive value (NPV) of 0.88 for 30-day mortality (Table 3). Similarly, its predictive performance was poor for 90-day mortality, with an AUC of 0.57 and best Youden Index of 0.13, whereas the FIB-4 and ABIC score displayed a significantly better AUC of 0.79 and 0.78 and higher best Youden Index of 0.49 and 0.63, respectively (Figure 1D, Table 4). Additionally, the Cox hazard ratio of death for gelatinase-positive vs gelatinase-negative patients was 0.6152, 95% confidence interval (0.1753, 2.159), p=0.448 for 30 days and 0.6389, 95% confidence interval (0.1818, 2.245), p=0.485 for 90 days.
TABLE 2. Number of gelatinase-positive and gelatinase-negative patients in each country.
|
Number |
Spain |
UK |
France |
Mexico |
Canada |
USA |
|---|---|---|---|---|---|---|
|
Gelatinase positive |
4 |
0 |
4 |
1 |
0 |
11 |
|
Gelatinase negative |
2 |
12 |
4 |
2 |
6 |
19 |
–
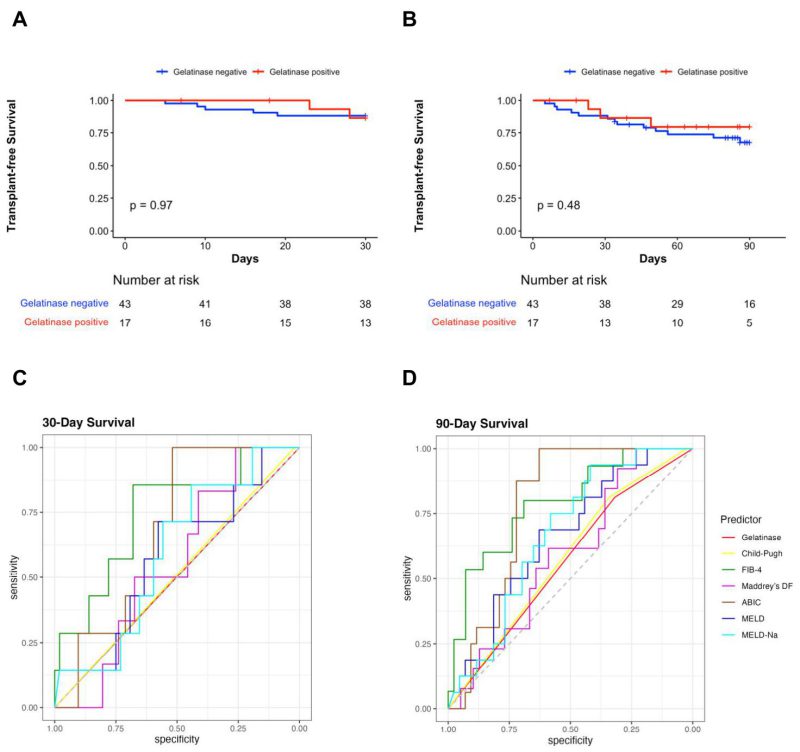 | FIGURE 1: Fecal gelatinase does not predict 30-day or 90-day mortality in patients with alcohol-associated hepatitis. (A) Kaplan-Meier curve for 30-day survival in gelatinase positive and gelatinase negative patients with alcohol-associated hepatitis. (B) Kaplan-Meier curve for 90-day survival in gelatinase positive and gelatinase negative patients with alcohol-associated hepatitis. (C) ROC curves of liver disease markers for 30-day mortality in patients with alcohol-associated hepatitis. (D) ROC curves of liver disease markers for 90-day mortality in patients with alcohol-associated hepatitis (Gelatinase n=60, Child-Pugh n=57, FIB-4 n=57, Maddrey’s DF n=52, ABIC n=59, MELD score n=59, and MELD-Na score n=59). ABIC, ‘Age, serum bilirubin, INR, and serum creatinine score’; FIB-4, Fibrosis-4 Index; INR, international normalized ratio; Maddrey’s DF, Maddrey’s Discriminant Function; MELD, model for end-stage liver disease; MELD-Na, sodium-adjusted model for end-stage liver disease; ROC, receiver operating characteristic. |
–
Consistent with the findings above, the presence of fecal gelatinase exhibited low feature importance for predicting both 30-day and 90-day mortality according to random forest analysis, with very low mean decrease Gini score and mean decrease accuracy when compared with other established liver disease markers (Figure 2). The FIB-4 and ABIC scores were the best predictors for 30-day mortality per mean decrease Gini (Figure 2A) and mean decrease accuracy (Figure 2B). FIB-4 also had the highest predictive value for 90-day mortality by mean decrease GINI (Figure 2C), whereas the ABIC score had the highest predictive value for 90-day mortality by mean decrease accuracy (Figure 2D).
TABLE 3. 30-Day Mortality Predictors.
|
Marker |
AUC |
Threshold |
Youden |
Sens |
Spec |
Acc |
PPV |
NPV |
p |
|---|---|---|---|---|---|---|---|---|---|
|
Gelatinase |
0.50 |
Presence |
0.00 |
0.29 |
0.72 |
0.67 |
0.12 |
0.88 |
– |
|
Child-Pugh |
0.51 |
B |
0.02 |
1.00 |
0.02 |
0.14 |
0.12 |
1.00 |
0.949 |
|
FIB-4 |
0.75 |
8.37 |
0.54 |
0.86 |
0.68 |
0.70 |
0.27 |
0.97 |
0.059 |
|
Maddrey’s DF |
0.56 |
132.70 |
0.26 |
1.00 |
0.26 |
0.35 |
0.15 |
1.00 |
0.716 |
|
ABIC |
0.68 |
7.83 |
0.52 |
1.00 |
0.52 |
0.58 |
0.22 |
1.00 |
0.214 |
|
MELD |
0.58 |
23.94 |
0.29 |
0.71 |
0.58 |
0.59 |
0.19 |
0.94 |
0.690 |
|
MELD-Na |
0.59 |
25.46 |
0.30 |
0.86 |
0.44 |
0.49 |
0.17 |
0.96 |
0.583 |
The best threshold was determined to maximize the Youden index (= sensitivity + specificity – 1) for each marker. Gelatinase n=60, Child-Pugh n=57, FIB-4 n=57, Maddrey’s DF n=52, ABIC n=59, MELD score n=59, and MELD-Na score n=59. ABIC, ‘Age, serum bilirubin, INR, and serum creatinine score’; Acc, accuracy; AUC, area under the curve; Gel, Gelatinase; FIB-4, Fibrosis-4 Index; INR, international normalized ratio; Maddrey’s DF, Maddrey’s Discriminant Function; MELD, model for end-stage liver disease; MELD-Na, sodium-adjusted model for end-stage liver disease; NPV, negative predictive value; PPV, positive predictive value; Sens, sensitivity; Spec, specificity.
–
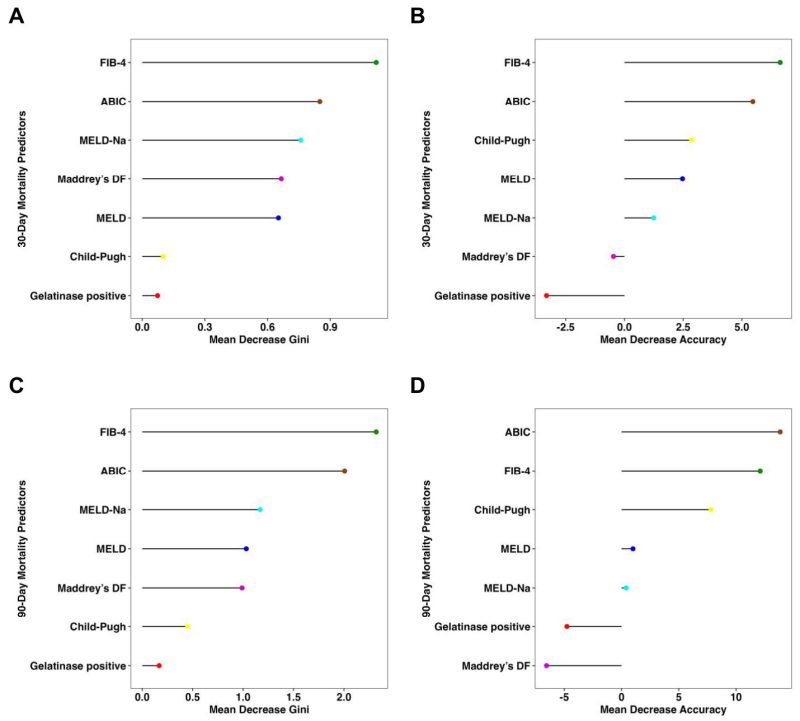 | FIGURE 2: Fecal gelatinase is not an important feature for 30-day or 90-day survival in patients with alcohol-associated hepatitis per random forest analysis. (A) Mean decrease Gini score and (B) mean decrease accuracy for 30-day mortality by random forest analysis were quantitated for presence of gelatinase and multiple liver disease markers to determine their respective feature importance for mortality. (C) Mean decrease Gini score and (D) mean decrease accuracy for 90-day mortality by random forest analysis were quantitated for gelatinase and multiple liver disease markers to determine their respective feature importance for mortality (Gelatinase n=60, Child-Pugh n=57, FIB-4 n=57, Maddrey’s DF n=52, ABIC n=59, MELD score n=59, and MELD- Na score n=59). ABIC, ‘Age, serum bilirubin, INR, and serum creatinine score’; FIB-4, Fibrosis-4 Index; INR, international normalized ratio; Maddrey’s DF, Maddrey’s Discriminant Function; MELD, model for end-stage liver disease; MELD-Na, sodium-adjusted model for end-stage liver disease. |
Fecal Gelatinase-Positive Patients do not Exhibit More Severe Liver Disease than Gelatinase-Negative Patients
Next, we conducted a comprehensive comparison of various liver disease indicators between the gelatinase-positive and gelatinase-negative groups. The markers assessed included AST, ALT, GGT, AP, bilirubin, FIB-4, Maddrey’s DF, ABIC, MELD score, and MELD-Na score. Our analysis revealed no significant differences between the gelatinase-positive and gelatinase-negative groups (Figure 3). AST levels in gelatinase-positive patients were higher compared with gelatinase-negative patients but the difference was not statistically significant (medians of 167 U/L vs. 128 U/L, P = 0.051) (Figure 3A). The levels of ALT showed similarity between gelatinase-positive and gelatinase-negative patients (medians of 55.0 U/L vs. 42.5 U/L, P = 0.24) (Figure 3B). GGT levels were 189 U/L in gelatinase-positive patients and 162 U/L in gelatinase-negative patients (Figure 3C). The alkaline phosphatase and bilirubin levels between gelatinase-positive and gelatinase-negative patients were very similar (medians of 152 mg/dL vs. 181 mg/dL, P = 0.76, and medians of 13.7 mg/dL vs. 14.1 mg/dL, P = 0.80, respectively) (Figure 3D, 3E). The median value of FIB-4 was 8.64 in gelatinase-positive patients and 6.28 in gelatinase-negative patients. Additionally, the median values of Maddrey’s DF (67.1 vs. 71.7) and ABIC (7.84 vs. 8.12) were lower in gelatinase-positive patients compared with gelatinase-negative patients. Furthermore, the median values of MELD score and MELD-Na score between gelatinase-positive and gelatinase-negative patients were nearly identical (Figure 3F-J). Additionally, we found that seven out of 56 patients (30.4%) with MELD>20 were gelatinase-positive, compared with two out of eight patients (25.0%) with MELD of 20 or lower were gelatinase-positive (P = 0.76, Pearson’s Chi-squared test). Furthermore, ten out of 28 patients (35.7%) on steroids were gelatinase-positive, whereas nine out of 36 patients (25.0%) were not on steroids (P= 0.35, Pearson’s Chi-squared test). Additionally, four out of 15 patients (26.7%) on antibiotics were gelatinase-positive, compared with 15 out of 49 patients (30.6%) not on antibiotics (P = 0.77, Pearson’s Chi-squared test). Finally, we found that neither gender nor overweight or obesity were associated with gelatinase positivity (data not shown).
TABLE 4. 90-Day Mortality Predictors.
|
Marker |
AUC |
Threshold |
Youden |
Sens |
Spec |
Acc |
PPV |
NPV |
p |
|---|---|---|---|---|---|---|---|---|---|
|
Gelatinase |
0.57 |
Absence |
0.13 |
0.81 |
0.32 |
0.45 |
0.30 |
0.82 |
– |
|
Child-Pugh |
0.58 |
C |
0.15 |
0.81 |
0.34 |
0.47 |
0.32 |
0.82 |
0.877 |
|
FIB-4 |
0.79 |
7.75 |
0.49 |
0.80 |
0.69 |
0.72 |
0.48 |
0.91 |
0.019 |
|
Maddrey’s DF |
0.59 |
48.08 |
0.23 |
1.00 |
0.23 |
0.42 |
0.30 |
1.00 |
0.574 |
|
Maddrey’s DF |
0.59 |
51.98 |
0.23 |
0.92 |
0.31 |
0.46 |
0.31 |
0.92 |
0.574 |
|
ABIC |
0.78 |
7.83 |
0.63 |
1.00 |
0.63 |
0.73 |
0.50 |
1.00 |
0.012 |
|
MELD |
0.66 |
23.94 |
0.32 |
0.69 |
0.63 |
0.64 |
0.41 |
0.84 |
0.250 |
|
MELD-Na |
0.67 |
24.67 |
0.36 |
0.94 |
0.42 |
0.56 |
0.38 |
0.95 |
0.214 |
The best threshold was determined to maximize the Youden index (= sensitivity + specificity – 1) for each marker. Gelatinase n=60, Child-Pugh n=57, FIB-4 n=57, Maddrey’s DF n=52, ABIC n=59, MELD score n=59, and MELD-Na score n=59. ABIC, ‘Age, serum bilirubin, INR, and serum creatinine score’; Acc, accuracy; AUC, area under the curve; Gel, Gelatinase; FIB-4, Fibrosis-4 Index; INR, international normalized ratio; Maddrey’s DF, Maddrey’s Discriminant Function; MELD, model for end-stage liver disease; MELD-Na, sodium-adjusted model for end-stage liver disease; NPV, negative predictive value; PPV, positive predictive value; Sens, sensitivity; Spec, specificity.
–
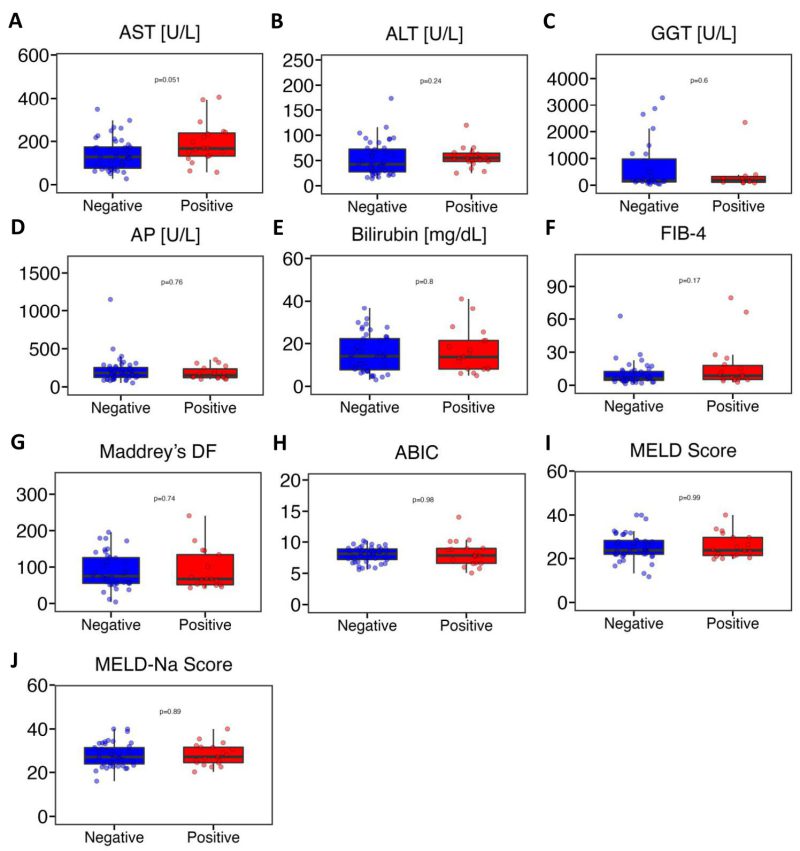 | FIGURE 3: Fecal gelatinase positive patients with alcohol-associated hepatitis do not have more severe liver disease than gelatinase negative patients. (A) AST (n=64). (B) ALT (n=63). (C) GGT (n=38). (D) AP (n=63). (E) Bilirubin (n=64). (F) FIB-4 (n=62). (G) Maddrey’s DF (n=56). (H) ABIC (n=64). (I) MELD score (n=64). (J) MELD-Na score (n=64). ABIC, ‘Age, serum bilirubin, INR, and serum creatinine score’; ALT, alanine aminotransferase; AP, alkaline phosphatase; AST, aspartate aminotransferase; FIB-4, Fibrosis-4 Index; GGT, gamma-glutamyltransferase; HE, hepatic encephalopathy; INR, international normalized ratio; Maddrey’s DF, Maddrey’s Discriminant Function; MELD, model for end-stage liver disease; MELD-Na, sodium-adjusted model for end- stage liver disease. P value of equal or less than 0.05 was considered as statistically significant. |
DISCUSSION
The development and exacerbation of alcohol-associated liver disease has been strongly linked to alterations in gut microbiota 7. Notably, in mouse models, the prevalence and overgrowth of cytolysin-positive E. faecalis in the gut were associated with the severity of ethanol-induced liver disease 24. Furthermore, ethanol feeding led to the expansion of specific strains of Enterococcus and their translocation to the liver, particularly in conditions where gastric acid was lacking 24. More importantly, patients with alcohol-associated hepatitis carried significant higher amounts of E. faecalis compared with both non-alcoholic individuals and those with alcohol-use disorder 8. The presence of gut-colonized cytolysin-positive E. faecalis has been shown to predict the mortality of patients with alcohol-associated hepatitis 8. However, this seems to be confined to alcohol-associated hepatitis, as cytolysin-positivity is not associated with increased disease severity or mortality in nonalcoholic fatty liver disease, acutely decompensated cirrhosis, or acute-on-chronic liver failure 25, 26.
Except for the prevalence in patients with alcohol-associated liver disease, E. faecalis are well-known opportunistic pathogens that cause nosocomial infections. However, unlike Enterococcus faecium, which shows a high proportion of vancomycin resistance, E. faecalis isolates from patients with bloodstream infections exhibit a low rate of vancomycin resistance (13.0% vs. 1.1%) and have remained relatively stable over the years 27. In contrast to the lower risk of antimicrobial resistance, the pathogenicity of E. faecalis raises significant concerns in clinical settings. Infections caused by E. faecalis are associated with high mortality rates. In Germany, patients with E. faecalis bloodstream infections had an all-cause in-hospital mortality and 90-day mortality of 23% and 37%, respectively 28. In Mexico, infections caused by linezolid-resistant E. faecalis resulted in an 18% mortality rate, which was higher than the control groups (9%) without linezolid-resistant strains 29. Specifically, among patients with E. faecalis bacteremia in Mexico, the reported mortality was 10% 30. Thus, detecting pathogenic E. faecalis strains will have therapeutic implications, as targeted modulation of the intestinal microbiome and its products can improve alcohol-associated liver disease 8.
The pathogenicity of E. faecalis is attributed to various virulence factors that enhance adherence, colonization, and invasion. In addition to cytolysin, gelatinase is considered a virulence factor of E. faecalis. It has been reported that gelatinase promotes microbial cell aggregation and accelerates biofilm formation 18. However, the relationship between fecal gelatinase and mortality of patients with alcohol-associated hepatitis remained unclear. This study is the first study to investigate the role of fecal gelatinase in liver disease and particularly in patients with alcohol-associated hepatitis using a multicenter cohort. Firstly, fecal gelatinase was identified in 30.8% (20/65) of patients with alcohol-associated hepatitis. Although Enterococcus species are commonly found in the human gastrointestinal tract, the prevalence of E. faecalis varies among individuals when identified using culture-based methods 31. Furthermore, among cultured E. faecalis isolates from patients and healthy subjects, the prevalence of gelatinase activity was reported as 59.5% (128/215), and no significant difference in prevalence was observed between clinical disease-associated isolates and fecal isolates from healthy individuals 20. Among urinary isolates from patients with urinary tract infections, gelE was detected in 87% (52/60) of E. faecalis isolates 32.
Regarding the clinical outcomes, no significant differences in 30-day or 90-day survival were observed between gelatinase-positive and gelatinase-negative alcohol-associated hepatitis groups. Furthermore, no liver disease markers were associated with presence of fecal gelatinase. Additionally, a high MELD score, steroid use, or antibiotic treatment were not associated with a gelatinase-positive status. We also excluded the potential effect of cytolysin, as there was no difference in gelatinase positivity between the cytolysin-positive and cytolysin-negative groups. These results indicate that fecal gelatinase does not predict mortality in patients with alcohol-associated hepatitis in our cohort. However, we acknowledge the limitation of this study that the small sample size may cause bias. Nevertheless, if our 90-day survival data for both groups (3/17=17.6% deaths in gelatinase-positive and 13/43=30.2% deaths in gelatinase-negative patients with standard deviations of 0.39 and 0.46, respectively) is used, the required total sample size of patients with alcohol-associated hepatitis would be 610 per two-tailed analysis with an alpha of 0.05, power of 0.95 and 1:1 allocation 33. Given a very small non-significant difference between the two groups in our analysis, a very large total number would hence be required to detect a possibly statistically significant difference. However, given this very large required number of patients, it is unclear whether the difference – even if it were significant then – would translate into a meaningful clinical difference. Another limitation of our study is that the InTeam Consortium only requires at least a 3-month history of active alcohol abuse, whereas other entities require at least a 6-month history for a diagnosis of alcohol-associated hepatitis (e.g. American Association for the Study of Liver Diseases (AASLD) 34. This could have resulted in a misclassification or overinclusion of patients in our study. Given the nature of the multicenter study, the use of the respective hospital laboratory of each research center might have contributed to inaccuracies or biases of laboratory markers between the different centers. However, significant differences in clinical outcomes including laboratory markers and survival would have very likely been detected between gelatinase-positive and gelatinase-negative patients if presence of fecal gelatinase had been a clinically meaningful marker in alcohol-associated hepatitis. In the future, the genome-wide screening of virulence factors of E. faecalis can be a good way to identify better predictive markers for alcohol-associated hepatitis, possibly with a similarly very good predictive value for mortality as cytolysin 8, 35.
Besides fecal samples, in a separate multicenter and prospective study of E. faecalis bacteremia, it was found that 64% (141/219) blood-originated isolates produced gelatinase, while 14-day mortality was not associated with the production of gelatinase 21. However, it is important to note that the function of gelatinase is multifactorial and is regulated by quorum sensing system in E. faecalis 36, and further studies on its regulatory system are warranted.
In conclusion, in our cohort, fecal gelatinase does not predict mortality and does not indicate higher disease severity in patients with alcohol-associated hepatitis.
MATERIALS AND METHODS
Patient Cohorts
A total of 65 patients with alcohol-associated hepatitis were enrolled between June 2014 and January 2019 (Figure S1). Patients were recruited from the Gastroenterology/Hepatology clinics (if outpatient) and hospitals (if inpatient) of the InTeam Consortium across various countries including the USA, Mexico, Canada, UK, France, and Spain. The clinical data and follow-up data of patients (including dates of death) were collected and submitted separately by each hospital/research center using a secure clinical data submission system 8, 37, 38. The patients were followed up until the last time they were seen in clinic or the hospital before being censored or until each center was notified of the confirmed death (with a specific date of death). The inclusion criteria were as follows: recent active alcohol abuse (more than 50 g/day for men and more than 40 g/day for women) within the past three months, coupled with elevated aspartate aminotransferase (AST) levels exceeding alanine aminotransferase (ALT) and total bilirubin >3 mg/dl over the last three months (ClinicalTrials.gov identifier number NCT02075918) 8, 38, 35. Either a clinically indicated liver biopsy or clinical presentation aligning with the diagnosis of alcohol-associated hepatitis was also required. Exclusion criteria included autoimmune liver disease (antinuclear antibody greater than 1:320), chronic viral hepatitis, hepatocellular carcinoma, complete portal vein thrombosis, terminal extrahepatic illness, pregnancy, and absence of signed informed consent 8, 38, 35.
The protocol was approved by the Ethics Committees at various institutions including Hôpital Huriez (Lille, France), Universidad Autonoma de Nuevo Leon (Monterrey, Mexico), Hospital Universitario Vall d’Hebron (Barcelona, Spain), King’s College London (London, UK), University of Alberta (Edmonton, Canada), Yale University (New Haven, USA), University of North Carolina at Chapel Hill (Chapel Hill, USA), Columbia University (New York, USA), University of Pittsburgh (Pittsburgh, USA), University of Wisconsin (Madison, USA), VA San Diego Healthcare System (San Diego, USA), and University of California San Diego (La Jolla, USA). Written informed consent was collected from each patient upon enrollment.
The body-mass index (BMI) was calculated during the clinical office visit. The laboratory markers, including AST, ALT, gamma-glutamyltransferase (GGT), alkaline phosphatase (AP), bilirubin, albumin, international normalized ratio (INR), creatinine, white blood count (WBC), hemoglobin, and platelets were quantified in the hospital laboratories of the respective centers. The Fibrosis-4 Index (FIB-4) equals (age*AST)/(platelets*√ALT) 39. The ‘Age, serum bilirubin, INR, and serum creatinine score’ (ABIC score) corresponds to [(age*0.1) + (bilirubin*0.08) + (creatinine*0.3) + (INR*0.8)] 40. The Child-Pugh class as a severity marker of cirrhosis can be A (5-6 points), B (7-9 points), or C (10-15 points), C being the most severe class. The respective Child-Pugh class is defined by the point sum of the various severity markers: encephalopathy (none = 1 point, grade 1 and 2 = 2 points, grade 3 and 4 = 3 points), ascites (none = 1 point, slight = 2 points, moderate = 3 points), bilirubin (<2 mg/dL = 1 point, 2-3 mg/dL = 2 points, > 3 mg/dL = 3 points), albumin (>3.5 g/dL = 1 point, 2.8-3.5 g/dL = 2 points, <2.8 g/dL = 3 points) and prothrombin time (<4 sec = 1 point, 4-6 sec = 2 points, >6 sec = 3 points)/INR (<1.7 = 1 point, 1.7-2.2 = 2 points, >2.2 = 3 points) 41. Maddrey’s discriminant function (Maddrey’s DF) is defined by [bilirubin + 4.6*(patient’s prothrombin time – control prothrombin time)] 42. The model for end-stage liver disease (MELD) equals [9.57*ln(creatinine) + 3.78*ln(bilirubin) + 11.20*ln(INR) + 6.43] 43. MELD-Na was calculated by MELD + (140 – sodium) − [0.025 × MELD × (140 − sodium)] 44.
Fecal DNA Extraction and Real-time Quantitative Polymerase Chain Reaction (RT-qPCR)
Human stool samples were collected from the patients and immediately stored at -80°C. For DNA extraction, 250 mg of stool were placed in 2 mL screw-cap tubes (Stellar scientific, #T20-C3220-SG). 500 μL of InhibitEX Buffer were added to each stool sample and kept on ice throughout. Samples were homogenized using a bead beater. Subsequently, genomic DNA from human stool was extracted using the QIAamp Fast DNA Stool Mini Kit (Qiagen, #51604) following the provided instructions 45. RT-qPCR was conducted using SYBR qPCR with a touch-down protocol and KAPA-SYBR FAST qPCR master mix (Roche Diagnostics, #07959389001) 46. The qPCR reaction mix for each sample consisted of 10 μL 2x Kapa SYBR, 0.4 μL 100 μM forward primer, 0.4 μL 100 μM reverse primer, 2 μL DNA template, and 7.2 μL water. The PCR conditions were as follows: initial denaturation at 95°C for 30s, followed by 6 cycles of denaturation at 95°C for 3s, annealing and extension at 65°C for 20s, and 72°C for 1s; subsequently, 33 cycles of denaturation at 95°C for 3s, annealing and extension at 58°C for 20s, and 72°C for 1s; finally a melting curve from 65 to 95°C with an increase of 0.5°C per cycle for 5s. The following primer sequences were used: 16S rRNA 47 forward: 5′-GTGSTGCAYGGYTGTCGTCA-3′; reverse: 5′-ACGTCRTCCMCACCTTCCTC-3′. E. faecalis gelE 48 forward: 5′-TATGACAATGCTTTTTGGGAT-3′; reverse: 5′-AGATGCACCCGAAATAATATA-3′. The wild-type E. faecalis V583 and the E. faecalis V583 ∆gelE served as positive and negative controls, while nuclease-free water served as a no-template control. Once amplification was complete, the system automatically generated Ct (cycle threshold) values for each reaction. The average Ct values of E. faecalis V583, E. faecalis V583 ∆gelE, and water were 11.23, 30.53, and 37.26, respectively. A cut-off Ct value of <30 was applied for the presence of gelatinase.
Statistical Analysis
R statistical software (R version 1.3.1093, 2020 the R Foundation for Statistical Computing) was used to perform statistical analyses. Results are described as median and interquartile range for each continuous outcome and as number and percentage for factor variables. We used the pROC library in R to calculate Area under the receiver operating characteristic (ROC) curve (AUC) and best threshold to maximize the Youden Index. We also used the pROC library to calculate sensitivity, specificity, accuracy, positive predictive value (PPV), negative predictive value (NPV) – all at the described respective threshold – and P values between two AUCs per Delong method 49. Kaplan-Meier curves were created and the statistical significance of a difference was calculated to demonstrate the transplant-free survival of gelatinase-positive vs gelatinase-negative groups using the survival and survminer libraries in R; censoring out of participants was indicated by vertical ticks. The random forest library was carried out to calculate mean decrease Gini score and mean decrease accuracy 50. Continuous variables were compared using the Mann-Whitney U test. A two-tailed P value < 0.05 was considered statistically significant.
SUPPLEMENTAL INFORMATION
 Download Supplemental Information
ACKNOWLEDGMENTS
This work was supported by National Institutes of Health (NIH) grant K12 HD105271, University of California San Diego Altman Clinical and Translational Research Institute (ACTRI)/NIH grant KL2TR001444, Pinnacle Research Award in Liver Diseases Grant #PNC22-159963 from the American Association for the Study of Liver Diseases Foundation, and a Pilot/Feasibility Grant from the San Diego Digestive Diseases Research Center (SDDRC) (to P.H.), NIH grants R01 AA24726, R37 AA020703, U01 AA026939, by Award Number BX004594 from the Biomedical Laboratory Research & Development Service of the VA Office of Research and Development, and by a Harrington Scholar-Innovator Award from the Harrington Discovery Institute at University Hospitals in Cleveland, Ohio (to B.S.) and services provided by NIH centers P30 DK120515 and P50 AA011999.
COPYRIGHT
© 2024

Fecal gelatinase does not predict mortality in patients with alcohol-associated hepatitis by Yang et al. is licensed under a Creative Commons Attribution 4.0 International License.