Research Articles:
Microbial Cell, Vol. 11, No. 1, pp. 143 - 154; doi: 10.15698/mic2024.05.822
Exploring carbon source related localization and phosphorylation in the Snf1/Mig1 network using population and single cell-based approaches
1Department of Mathematical Sciences, Chalmers University of Technology, University of Gothenburg, Sweden. 2Department of Biotechnology and Biosciences, University of Milano-Bicocca, Italy. 3Department of Biology and Biological Engineering, Department of Mathematical Sciences, Chalmers University of Technology, Sweden.
Keywords: yeast, nutrient signaling, Snf1/Mig1 network, nuclear localization, fluorescence recovery after photobleaching, nonlinear mixed effect model.
Received originally: 14/06/2023 Received in revised form: 05/03/2024
Accepted: 12/03/2024
Published: 16/05/2024
Correspondence:
Farida Tripodi, Department of Biotechnology and BiosciencesUniversity of Milano-Bicocca, Piazza della Scienza 2, 20126 Milano, Italy; phone: +39 264483513; farida.tripodi1@unimib.it
Marija Cvijovic, Department of Mathematical Sciences, Chalmers University of Technology and University of Gothenburg, SE-412 96 Gothenburg, Sweden; phone: +46 317725321; marija.cvijovic@chalmers.se
Conflict of interest statement: None declared.
Please cite this article as: Svenja Braam, Farida Tripodi, Linnea Österberg, Sebastian Persson, Niek Welkenhuysen, Paola Coccetti, Marija Cvijovic (2024). Exploring carbon source related localization and phosphorylation in the Snf1/Mig1 network using population and single cell-based a pproaches. Microbial Cell 11: 143-154. doi: 10.15698/mic2024.05.822
Abstract
The AMPK/SNF1 pathway governs energy balance in eukaryotic cells, notably influencing glucose de-repression. In S. cerevisiae, Snf1 is phosphorylated and hence activated upon glucose depletion. This activation is required but is not sufficient for mediating glucose de-repression, indicating further glucose- dependent regulation mechanisms. Employing fluorescence recovery after photobleaching (FRAP) in conjunction with non-linear mixed effects modelling, we explore the spatial dynamics of Snf1 as well as the relationship between Snf1 phosphorylation and its target Mig1 controlled by hexose sugars. Our results suggest that inactivation of Snf1 modulates Mig1 localization and that the kinetic of Snf1 localization to the nucleus is modulated by the presence of non-fermentable carbon sources. Our data offer insight into the true complexity of regulation of this central signaling pathway in orchestrating cellular responses to fluctuating environmental cues. These insights not only expand our understanding of glucose homeostasis but also pave the way for further studies evaluating the importance of Snf1 localization in relation to its phosphorylation state and regulation of downstream targets.
Introduction
Protein kinases within the Snf1/AMPK family are highly conserved master regulators of energy homeostasis in eukaryotic cells 1, 2. They mediate signaling of energy demand, a process central to ensure continuous cell growth and cell development, one of the most important aspects of a cell’s lifecycle.
In the yeast Saccharomyces cerevisiae, Snf1 is involved in adaptation to glucose limitation when the use of alternative carbon sources is needed to achieve growth and proliferation 3, 4, 5. The Snf1 signaling pathway also affects a broad spectrum of downstream functions, such as lipid biogenesis and gluconeogenesis to balance energy demand and supply 6, 7. In addition to its role in energy homeostasis, Snf1 participates in several stress signaling pathways, indicating a more extensive involvement 4, 8.
Snf1 is the catalytic subunit of the heterotrimeric complex that we will refer to as SNF1 throughout this paper. This complex consists of the regulatory γ-subunit Snf4 and one of three alternative β-subunits, Gal83, Sip1 or Sip2 9, 10. The β-subunits control the location of the SNF1 complex within the cell 11, and assembly in a complex with the γ-subunit and any of the β-subunits is necessary for stable Snf1 kinase activity 9, 10, 12.
Previous studies have indicated that localization of the various β-subunits to cell compartments differs depending on carbon source 11, 13. Shifting the carbon source in the medium from high glucose content to ethanol results in localization of SNF1 to the nucleus 11.
One important mechanism that involves SNF1 is glucose de-repression, which describes the cell’s preference to utilize glucose over alternative carbon sources and is mediated by the phosphorylation and dephosphorylation of Snf1. Continuous phosphorylation of Snf1 via the three upstream kinases Sak1, Tos3 and Elm1 activates the expression of genes that are necessary for utilizing alternative carbon sources 14, 15, 16, 17. Dephosphorylation of Snf1 takes place rapidly by the PP1 phosphatases Reg1/2-Glc7, Sit4 or Ptc2 as soon as a preferred sugar such as the hexose sugars glucose, fructose or mannose becomes available 18, 19, 20, 21.
Active Snf1 phosphorylates several downstream target proteins, with the transcriptional repressor Mig1 being the most prominent 22, 23. Unphosphorylated Mig1 locates to the nucleus and mediates the repression of genes required for the utilization of alternative carbon sources 24, 25. Phosphorylation of Mig1 by Snf1 promotes its exit from the nucleus via the exportin Msn5 23, 26. This results in the initiation of glucose de-repression and allows the expression of genes, such as SUC2 and HXK1, which are required for the use of alternative carbon sources 23, 27, 28, 29.
Mig1 localization in response to various concentrations of hexoses has been studied before and is established as a measurement for the SNF1 pathway activity 30, 31, 32, 33.
However, overexpression of the upstream protein kinase Sak1 or addition of sodium and lithium ions leads to activation of Snf1, but not to glucose de-repression 14, 34. This leads to the conclusion that SNF1 activation is required but is not sufficient for mediating glucose de-repression and that a second glucose-regulated step governs the Snf1/Mig1 pathway activity 14. Understanding this aspect is critical because Mig1 is a common measure of SNF1 activity, and both Snf1 and Mig1 play vital roles in utilizing carbon sources.
A proposed model by Vega, Riera, Fernández-Cid, Herrero and Moreno 35, suggests that the Gal83 associated isoform of SNF1 has a structural role in the repression complex of SUC2, a gene co-regulated by Mig1 and Mig2. However, the importance of the SNF1 localization for glucose repression remains unclear.
To better understand the localization of Snf1 and its regulation in glucose de-repression, we utilize time-lapse fluorescence microscopy, fluorescence recovery after photobleaching (FRAP) and phosphorylation assays to study the nuclear-cytoplasmic shuttling of Snf1 and Mig1 in response to external carbon sources in various concentrations.
Results
The kinetics of Snf1 nucleocytoplasmic shuttling are driven by carbon source availability
To understand how Snf1 mechanistically mediates glucose de-repression, we employed FRAP. Exponentially grown yeast cells expressing GFP-tagged Snf1 were exposed to YNB supplemented with either 2% glucose (sustaining a fermentative metabolism), 0.05% glucose or 2% glycerol (two conditions in which metabolism is mainly respirative) for at least 1 h before the onset of measurements. Fluorescently tagged Snf1 in the nucleus was bleached, and the subsequent recovery of fluorescence in the nucleus was observed. The obtained data were analyzed by fitting a single exponential model using a nonlinear mixed-effects (NLME) framework (SI data files 2-4 as well as methods section for details, data available via https://github.com/cvijoviclab/Snf1-localization ) 36. The diagnostic plots in Figure 1 show that the model has good predictive power for all conditions tested, although values at the later time points might be underestimated, as can be seen by the outliers in the observed data in comparison to the prediction intervals. The good fit is indicated by the weighted residuals clustering randomly around the x-axis (Figure 1, right panel), and when simulated the fitted model can reproduce the observed data (for detailed plot of observed FRAP curves and predicted values see supplementary information 2-4). Cell size and nucleus size measurements in the cells tested showed that the fraction of the bleached nucleus was unaffected by the conditions applied, indicated by a non-significant Kruskal Wallis test (cell area p = 0.72, nucleus area p = 0.13) and spot tests indicated that Snf1-GFP is functional (Figures S3-4).
–
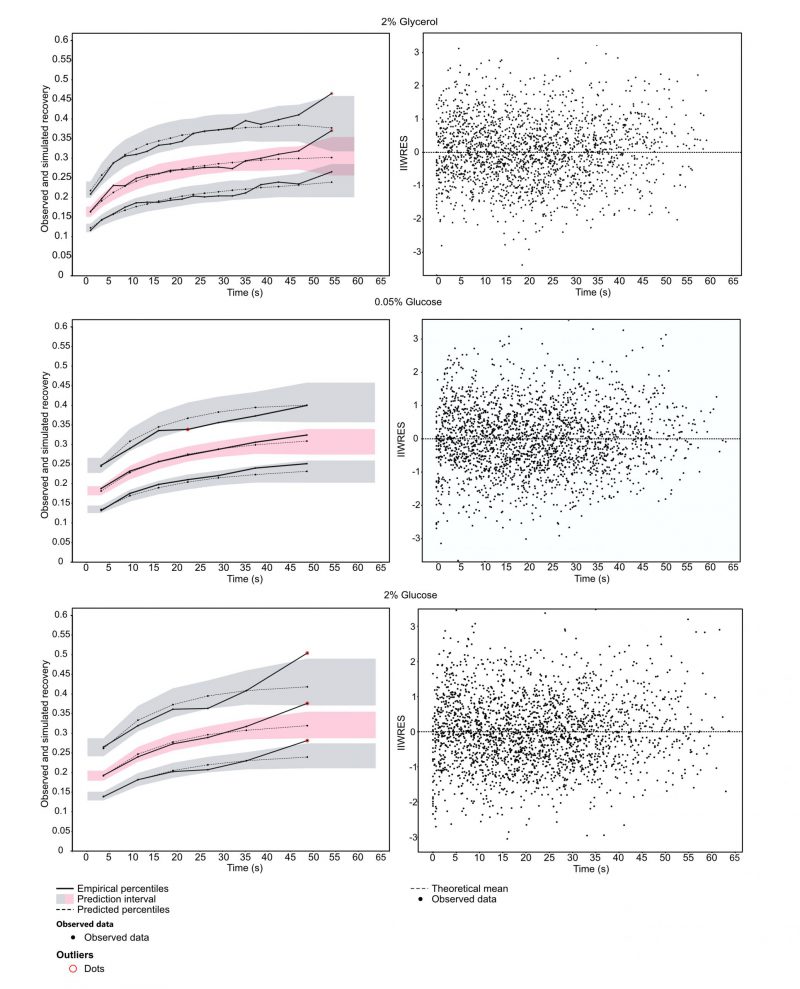 | FIGURE 1: Diagnosticplots of the NLME model used to predict population parameters. Left panel: visual predictive check to determine predictive power of the model. Datapoints were binned using least squares criteria and smoothed using linear interpolation. Solid line determines the observed data in the 10th,50th and 90th percentile. Gray/red areas are the prediction intervals for the respective percentile in which 90% of the simulated data lie, determined by 400 Monte Carlo simulations. Right panel: Scatterplots of individual residuals. Dots represent the individual weighted residuals over time represented by conditional mode of the distribution of residuals. |
–
The kinetic coefficient (τ) for Snf1-GFP when cells were exposed to 2% glycerol indicates a faster nuclear-cytoplasmic shuttling in comparison to the cells exposed to 2% or 0.05% glucose (Table 1). Activating kinases are typically contained in the cytoplasm and Snf1 nuclear localization is dependent on both, its phosphorylation and on the interaction with Gal83 11. Faster recovery for cells exposed to glycerol indicates a mechanism that is independent on glucose concentration but rather on the presence of a fermentable carbon source. The parameters furthermore indicated a large immobile fraction. This could hint towards a large entity of bound Snf1-GFP, for example to the β-subunit Gal83.
TABLE 1. FRAP population parameters for Snf1 separated by the fixed effects (A, τ, I0) and standard deviation of random effects (ωA1 , ωτ , ωI0 ), as well as parameters derived from the fixed effects.
|
|
2% glucose |
0.05% glucose |
2% glycerol |
|||
|---|---|---|---|---|---|---|
|
|
Yp |
S.E |
Yp |
S.E |
Yp |
S.E |
|
𝐴 |
0.172 |
0.011 |
0.168 |
0.0103 |
0.164 |
0.00994 |
|
τ |
0.0666 |
0.0074 |
0.0638 |
0.00839 |
0.0812 |
0.0134 |
|
I0 |
0.156 |
0.00607 |
0.152 |
0.0054 |
0.152 |
0.00615 |
| ω A |
0.302 |
0.0474 |
0.279 |
0.0466 |
0.273 |
0.0481 |
| ω τ |
0.491 |
0.0827 |
0.566 |
0.100 |
0.744 |
0.123 |
| ω
I
|
0.184 |
0.0286 |
0.160 |
0.026 |
0.183 |
0.0312 |
|
Number of cells total |
25 |
– |
24 |
– |
21 |
– |
|
Half-max (s) |
10.407 |
– |
10.864 |
– |
9.001 |
– |
|
Mobile fraction |
0.016 |
– |
0.016 |
– |
0.012 |
– |
|
Immobile fraction |
0. |
– |
0.984 |
– |
0.988 |
– |
Representations of the kinetic constant (τ) and mobility (A), the degree of bleaching (I0) as well as half-max time as representation of recovery rate and calculated mobile fraction representing proteins contributing to recovery and immobile fraction (for details see Method section). Data derived from cells pooled in three independent experiments.
To elucidate the steady-state accumulation of Snf1-GFP in the nucleus under these conditions, we compared the fraction of the total Snf1-GFP intensity in the nucleus by employing confocal microscopy. Snf1 steady-state nuclear fractions were comparable under high (2%) and low (0.05%) glucose concentrations (Figure 2A). A non-significant mean fold change of 1.06 (p-value = 0.5479), indicates that under steady-state conditions Snf1 localization was not modulated by glucose concentration.
–
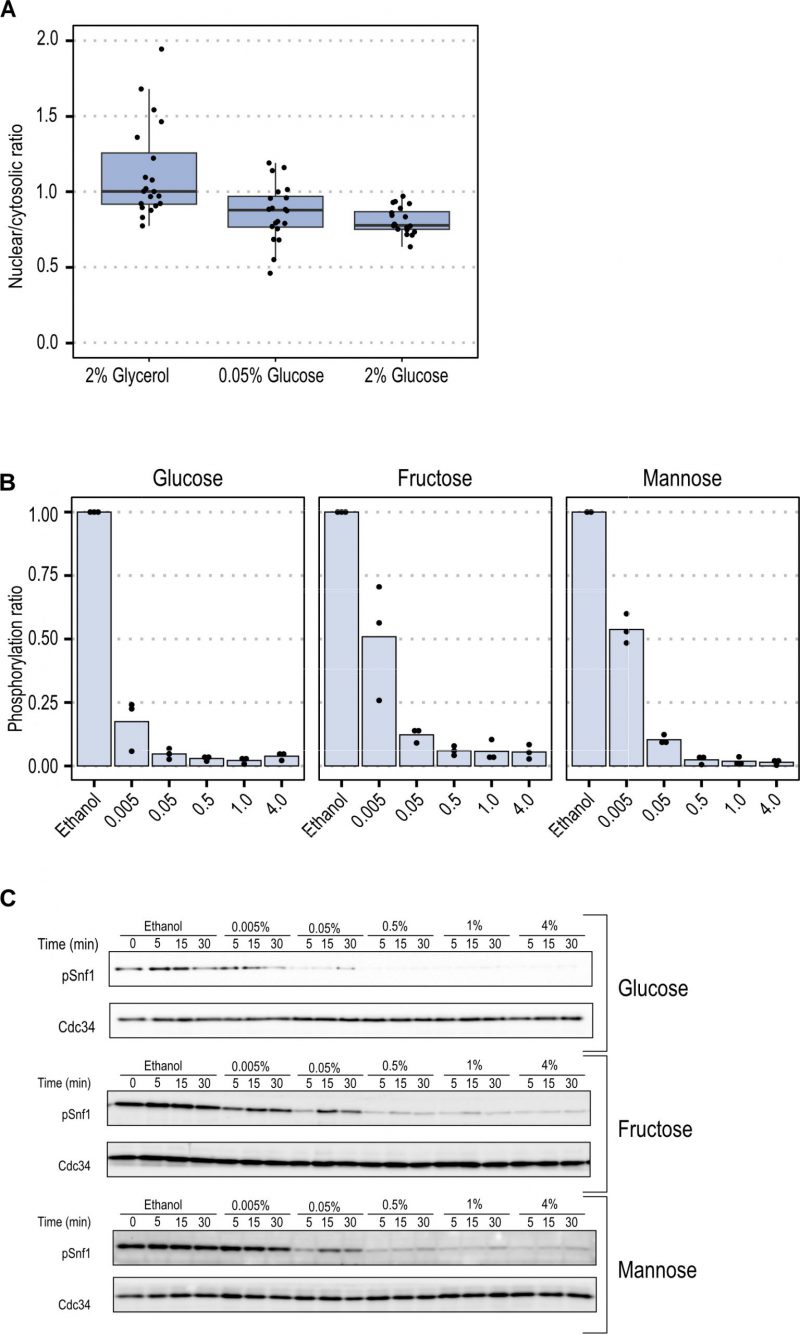 | FIGURE 2: Snf1 localization and Snf1 phosphorylation. (A) The nuclear-cytosolic ratio of Snf1-GFP was calculated by dividing the mean of the fluorescence of Snf1-GFP in the nucleus with the mean of the fluorescence in the cytosol. Horizontal lines indicate the mean, the boxplot has as lower and upper hinge respectively the 25thand 75th percentile and the whiskers denote the 95% confidence interval. Dots denote individual cells. (B) Mean of relative Snf1 phosphorylation by western blot quantification 5 minutes after upshift from ethanol to glucose, fructose or mannose, dots represent biological replicates.(C) Exemplary images of the western blot showing phosphorylated Snf1. |
–
Together with results from the FRAP measurements, this could suggest that Snf1 nuclear localization is not strongly influenced by changes in concentration of glucose and that the relative difference in glucose concentration has a smaller effect than the type of carbon source itself.
Snf1 phosphorylation status correlates with Mig1 localization upon carbon source upshift
The data from FRAP experiments indicated that Snf1 localization and nucleo-cytoplasmic shuttling parameters depend on the type of carbon source rather than on concentration. We set out to find if this relationship was also present in the short-term phosphorylation pattern of Snf1 in different fermentable sugars at various concentrations. To evaluate the activation state of Snf1 during the shift-up, cells were grown in YNB containing ethanol until mid-exponential phase. Then the fermentable carbon source (glucose, fructose or mannose) at the indicated concentrations was added to the culture. Samples were taken after 5 minutes to measure the pT210-Snf1 level (pSnf1) (Figure 2B and C, Figure S2). When the fermentable carbon source was added to the cells, a reduction of Snf1 phosphorylation was observed, with a magnitude proportional to the concentration added. Glucose was the carbon source which reduced phosphorylation of Snf1 more strongly since it was reduced to 20% already at a concentration of 0.005% and reached maximal reduction at 1% concentration. Fructose and mannose present similarly, with an inhibition of 50% at 0.005%, and a maximal inhibition at 0.5% concentration (Figure 3A).
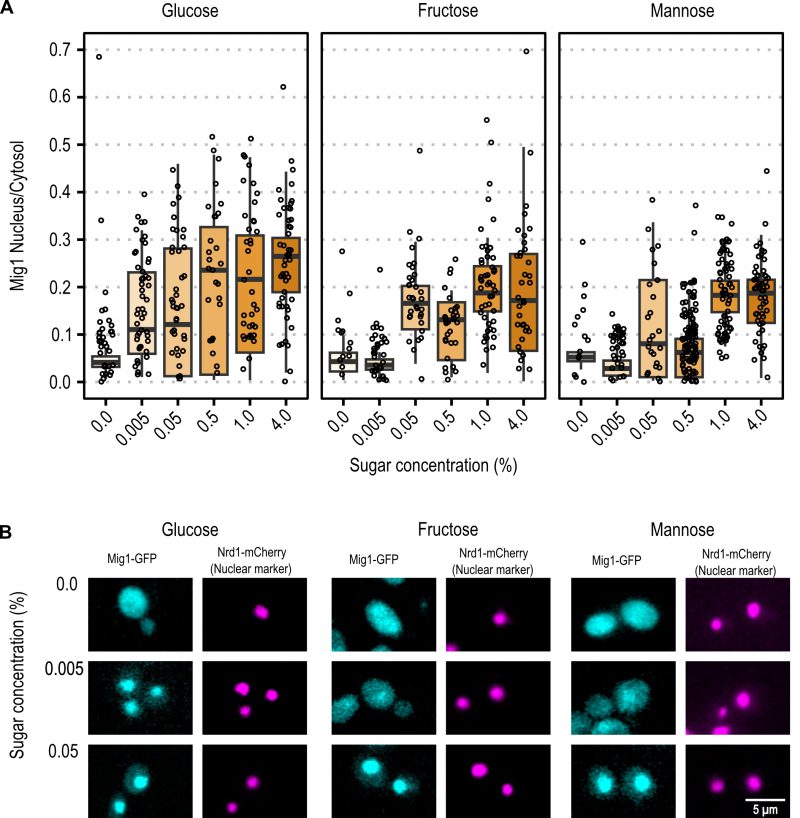 | FIGURE 3: Mig1 nuclear localization after upshift. (A) Mig1 nuclear localization ratio in cells 5 minutes after the shift from ethanol to the indicated concentration of glucose, fructose, or mannose. Horizontal lines indicate the mean, the boxplot has as lower and upper hinge respectively the 25thand 75th percentile and the whiskers denote the 95% confidence interval. Dots denote individual cells. (B) Microscopic images of single cells, representative for the tested cells in panel B, 5 minutes after shift from ethanol to the indicated conditions. Mig1-GFP is displayed in cyan and Nrd1-mCherry in magenta. Brightness and contrast have been adjusted for better visibility. |
–
With the same approach, the initial spatial Mig1 response towards different carbon sources was characterized through fluorescent time-lapse microscopy. Mig1 localization to the nucleus was observed at 0.005% glucose, while in upshift to mannose and fructose, Mig1 nuclear localization was only observed at concentrations above 0.05% (Figure 3A and Figure 3B for further exemplary images, Figure S1). These results suggest that the Mig1 nuclear import is more sensitive to glucose than to mannose and fructose, similarly, observed for Snf1 phosphorylation.
In order to better investigate the Snf1-Mig1 pathway, expression of two glucose repressed genes (i.e. SUC2 and HXK1) was analyzed by qPCR. Cells were grown in ethanol-containing YNB medium until mid-exponential phase. Cells were either left in ethanol, or glucose was added to the cultures at 0.05% or 4% final concentration. Samples were taken after 15 and 30 minutes to measure SUC2 and HXK1 expression (Figure 4). When the fermentable carbon source was added, the expression of both SUC2 and HXK1 was strongly reduced, similarly in the presence of low (0.05%) and high (4%) glucose concentration. This suggests that although glucose repression can be seen, expression of glucose repressed genes is not a sensitive readout to evaluate the dose-dependent Snf1 response to carbon sources. This could likely be the result of both transcriptional repression and rapid mRNA degradation that takes place upon glucose addition 37. The glucose concentration independent recovery time during FRAP further enforces this result by indicating that glucose concentration in the short term does not influence the nuclear import of Snf1 while it does influence the nuclear accumulation of Mig1.
–
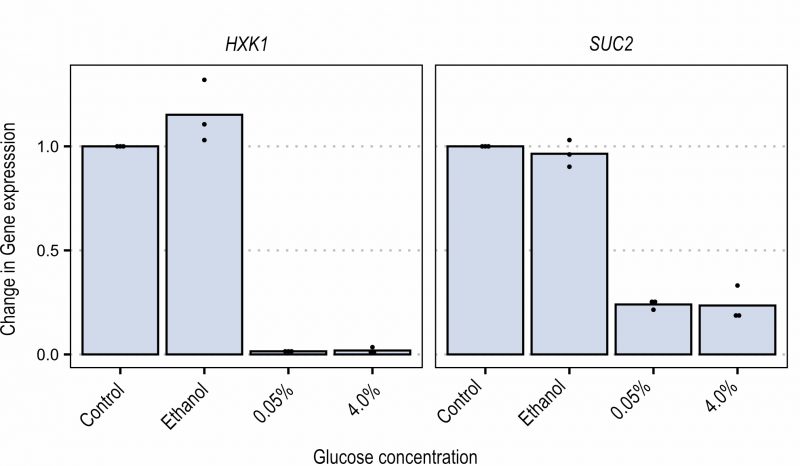 | FIGURE 4: Expression of HXK1 and SUC2 measured via qPCR, 15 minutes after shift to glucose. Data are shown as ratio change of gene expression. Control: baseline expression of cultures grown in ethanol at start of measurements. Dots represent biological replicates. |
Discussion
In this work we set out to explore the relationship between the subcellular localization and regulation of kinases in the context of carbon source signaling. We show that Snf1 responds to glucose with a decreased recovery rate during FRAP already at low glucose concentrations and that nuanced phosphorylation of Snf1 in response to various concentrations of hexose sugars corresponds with Mig1 localization to the nucleus.
We studied the kinetics of Snf1 nucleocytoplasmic shuttling by employing a FRAP method. Using NLME regression, we were able to determine recovery rates as well as showing that most of the fraction of bleached protein was immobile. Snf1 is part of the pathway wherein the transcriptional repressor Mig1 is responsible for glucose repression. While this pathway has been reported to be activated at higher glucose concentrations 38, 39, it has also been shown that gluconeogenic enzymes are tightly repressed even by small amounts of glucose via mechanisms such as mRNA degradation as a short-term reaction to changes in carbon source availability 37, 39. We furthermore observe the steady-state spatial distribution of Snf1 after exposing yeast cells to various concentrations of glucose and glycerol. The localization of Snf1 in the nucleus is significantly changing when comparing any of the nuclear-cytosolic ratios obtained from glucose-exposed cells to glycerol-exposed cells.
It is not possible to exclude whether residual glucose in the medium of cells exposed to low glucose in our FRAP experiment was present, however, it could indicate that nuclear cytosolic shuttling might be reduced even with small amounts of glucose present in the medium. The observed steady-state nuclear cytoplasmic ratio could be a further hint in this direction. It furthermore cannot be excluded that the reason for the reduced nucleocytoplasmic shuttling could lie in halted translation due to a stress response as reaction to the strong reduction of glucose in the medium in our experimental setting.
Previous studies suggest however, that the levels and the phosphorylation status of Snf1 are reciprocally regulated, as hyperphosphorylation has been observed when the level of Snf1 is lower than normal 40. Snf1 has been shown to be transiently phosphorylated after a shift to lower glucose indicating that Snf1 could also be involved in mediating cellular changes in response to concentrations of glucose, which affects the level of Snf1 phosphorylation and then its nuclear localization 30. Phosphorylation of Snf1 already at low concentrations of glucose after a switch from a non-fermentable carbon source in our study might further confirm the tight regulation of glucose repressed genes in the presence of even low amounts of glucose.
Gal83, the β-subunit responsible for Snf1 localization to the nucleus, has been shown to be detected in the nucleus after a shift to low glucose 11. One interpretation could entail that cells with a large fraction of the Snf1 pool bound to other processes need a higher activity of the nucleocytoplasmic shuttling to serve the same function. Under exposure to glycerol, this could indicate that a lower amount of mobile Snf1 would lead to a higher degree of phosphorylation in the available Snf1 and an increase in nucleocytoplasmic shuttling. Whereas under low glucose conditions tested in our experiment, Snf1, besides the possibility of halt in translation, could serve other functions than glucose signaling or is part of a stationary complex in the nucleus. This would fit with a model where nucleocytoplasmic shuttling is regulated by the Snf1 phosphorylation status and its interaction with Gal83 as response to the type and concentration of carbon source that determines its localization to the nucleus.
Further, we show that upon addition of fermentable sugars in various concentrations to cells grown in ethanol, Mig1 nuclear localization inversely correlates with the phosphorylation status of Snf1, linking inactivation of Snf1 with spatial distribution of one of its target proteins, which is in agreement with data reporting that Mig1 nuclear localization depends on Snf1-dependent phosphorylation 26.
Snf1-dephosphorylation was observed for 0.005% glucose, mannose, and fructose, with a more distinctive dephosphorylation for glucose. We report Mig1 localizing to the nucleus at 0.005% glucose, in accordance with previously reported results 30, 41. Our results contribute to that, in so far as we observed Mig1 nuclear localization at concentrations of 0.05% and above for mannose and fructose. For all hexoses, the Mig1 nuclear intensity increased in a dose-dependent manner, however, the trend of increase over concentration seems to be hexose specific.
The above observations could be a consequence of differing import rates of the tested hexose sugars, as for example the maximum import rate of glucose is lower than the import rate of fructose 42. Alternatively, it could be the result of differing first steps of metabolism for the tested sugars, since only glucose is rapidly converted to glucose-6-phosphate, which was shown to stimulate Snf1 dephosphorylation 43. It has furthermore been suggested that hexokinases which take part in the regulation of Mig1 in connection with Snf1 might exert their regulative function in a manner dependent on the type of hexose in the medium 31.
It remains unclear whether the above processes, a combination, or other regulatory mechanisms impact Mig1 phosphorylation by Snf1 and/or dephosphorylation by Reg1/Glc7.
HXK1 and SUC2 are subject to glucose repression mediated by Mig1. Our results indicate that glucose de-repression mediated by Snf1 could start already at concentrations of 0.05% glucose, where Mig1 is located mostly in the cytosol. Snf1 activity is necessary to mediate glucose de-repression, but interestingly Snf1 is showing a decreased phosphorylation ratio at 0.005% glucose and increased nucleocytoplasmic shuttling, strengthening the argument that Snf1 is more readily dephosphorylated in the presence of glucose, while Mig1 localizes to the nucleus as response to concentration of glucose. Previous studies revealed both a Snf1-dependent as well as -independent dephosphorylation of Mig1 33 and considering the fluctuations in environmental changes and the necessity of the cell to adapt to these, it seems plausible that mechanisms other than change in transcription through Mig1 might be at play 37.
Cellular signaling pathways are essential to sense and respond to external stimuli such as nutrients and other environmental cues, as well as their dynamic changes. At the systems level, a complex network of kinases and phosphatases plays a major role in the regulation of signaling pathways which are involved in the control of metabolism, cell cycle and growth 44, 45, 46, 47 .
The data presented in this paper reinforce the notion that not only the activation/inactivation of kinases but also their subcellular localization and that of their targets influence fate decisions in response to environmental changes.
Materials and Methods
Strain maintenance and growth conditions
If not stated otherwise, yeast strains were grown at 30°C in synthetic complete medium, containing 1.7 g/l yeast nitrogen base, 5 g/l ammonium sulfate, 670 mg/l complete supplement mix here referred to as YNB with appropriate drop out where applicable; supplemented with carbon source as indicated by the specific experiments. All media components except for carbon source were obtained from Formedium. Strains used in this study are listed in Table 2.
TABLE 2. Strains used in this study.
|
Name |
Relevant genotype |
|---|---|
|
BY4741 |
MATa his3Δ1 leu2Δ0 met15Δ0 ura3Δ0 |
|
BY4741 SNF1-GFP |
MATa his3Δ1 leu2Δ0 met15Δ0 ura3Δ0 SNF1-GFP-HIS3MX NRD1-mCherry-Hph |
|
W303-1A |
MATa leu2-3,112 trp1-1 can1-100 ura3-1 ade2-1 his3-11,15 |
|
W303-1A MIG1-GFP |
MATa leu2-3,112 trp1-1 can1-100 ura3-1 ade2-1 his3-11,15 NRD1mCherry-Hph MIG1-GFP-KanMX |
|
W303-1A snf1Δ |
MATa leu2-3,112 trp1-1 can1-100 ura3-1 ade2-1 his3-11,15 snf1::KanMX |
To ensure functionality of Snf1-GFP constructs, we conducted a spot test on non-feasible carbon sources that would lead to a decrease in growth if Snf1 functionality is impaired (see Figure S3).
Fluorescence Recovery After Photobleaching (FRAP)
Strain BY4741 SNF1-GFP was grown in YNB supplemented with 2% glucose to exponential phase, OD/ml ≈ 0.3, and immobilized on an 8-well chambered coverglass (Ibidi) coated with poly-L-lysine (Sigma). Media were switched to YNB with either 2% glucose, 0.05% glucose or 2% glycerol and incubated at 30°C for 1 h before imaging to ensure adaptation to the new carbon source. At least 21 cells distributed over three separate experiments per condition were imaged on a LSM700 laser scanning confocal microscope (Zeiss) using a Plan-Apochromat 63x /1.4 oil immersion objective, pinhole set to 1 AU for the longest wavelength and kept constant over all channels. FRAP was performed on GFP-tagged Snf1, excitation 488 nm, emission 518 nm, 2x zoom with framesize 596×596, pixel size of 0.09µm and pixel dwell time of 0.9 µs. The cells were continuously imaged for 100 frames, and bleaching was done in 100 bursts at 100% at 488 nm after 5 pre-scans using a circular ROI covering the nucleus. To determine fluorescence decay by acquisition, a reference area of adjacent cells was captured, as well as a circular ROI for baseline determination. Determination of bleach area covering the nucleus was achieved by imaging the nuclear marker mCherry-tagged Nrd1 (excitation: 555 nm, emission: 572 nm) and drawing a circular ROI around the determined area.
For image processing, the average fluorescence intensity as well as diameter of the imaged areas was extracted from the time-lapse image series for each image using the software ZEN2012 Black (Zeiss). Given the values for background intensity, the intensity for the nuclear region, as well as a reference region containing adjacent cells in the same frame, the measured intensities were processed by first removing background signal and normalizing prebleach phase to 1 by calculating the ratio of measured intensity at a given timepoint over the mean of intensities measured in the frames pre-bleach for both, the reference and the bleached region. Measurements that were aberrating due to cell movement were removed from the dataset after visual inspection of the acquired time series. Correction for acquisition bleaching was done in RStudio, version 1.4.1106 48, by calculating the median of the normalized reference regions and fitting the curve according to the following equation:
Iref(t)=I0refArefeτref*t
With I0ref=0 representing the baseline as fluorophores become bleached completely and data have been corrected for background noise.
With the parameters Aref and τref estimated by nonlinear least squares regression, measured FRAP intensities were interpolated and further used for nonlinear mixed effect modeling.
Data available at: 10.6084/m9.figshare.25397809 (FRAP movies) and 10.6084/m9.figshare.25397803 (FRAP Raw data).
Non-linear mixed effect model
Non-linear mixed-effects modelling is typically used for longitudinal data exhibiting both within- and in-between-subject variability 49. This method has been widely used in pharmacokinetic and pharmacodynamic studies 50, 51, but in recent years it is utilized in single-cell time-lapse data and facilitating our understanding of cell-to-cell variability 32, 36, 52, 53, 54. When analyzing fluorescence measurements of a tagged protein in single cells over time, the observed intensity will differ between measurements even if the cells are in a steady-state, due to measurement error. Moreover, owing to extrinsic variability, imaged fluorophores within cells will display different intensity levels. Using a mixed-effects framework, the observed cell-to-cell variability can be accounted for in the analysis by letting the rate parameters vary between cells according to a probability distribution. Furthermore, a mixed-effects framework allows the assessment of potential correlations between parameters in different cells.
To analyze dynamic measurements for Snf1-GFP from the FRAP experiment, a non-linear mixed-effect regression was implemented and simulated in Monolix (version 2023R1) 55, 56. The data, project files and models are available at the following github repository: https://github.com/cvijoviclab/Snf1-localization .
Assuming reaction dominant recovery, FRAP curves were fitted to a single exponential equation, summarizing experiments across conditions tested:
I0 represents the degree of bleaching, A is the mobility constant, τ is the kinetic constant of bound/unbound species and t is the time after bleach.
Speed of recovery can be calculated by determining the recovery half max time where 50% of the plateau of estimated fluorescence recovery is reached:
τ1/2=ln0.5/-τ
Mobile and immobile phase according to this model are represented as:
Steady-state localization microscopy
Strain BY4741 SNF1-GFP was grown in YNB supplemented with 2% glucose to exponential phase and immobilized on an 8-well chambered coverglass (Ibidi) coated with poly-L-lysine (Sigma). Media were exchanged by centrifugation and resuspended in YNB with either 2% glucose, 0.05% glucose or 2% glycerol at least 1 h before imaging to ensure adaptation to the new carbon source. At least 20 cells/condition were imaged on either ELYRA PS.1 SIM/PAL-M LSM780 (Zeiss) using Plan-Apochromat 40x /1.4 oil immersion objective.
Cell segmentation, extraction of mean intensities and background removal was done in the ImageJ distribution of Fiji 57 and MATLAB _R2019b. Plots and statistical analysis were done using RStudio, version 1.4.1106 48.
As the dataset did not pass the Shapiro–Wilk test, a non-parametric equivalent of ANOVA was used, the Kruskal-Wallis test. For pairwise comparison, a Wilcox test with Bonferroni correction was performed. These statistical tests were done in RStudio, version 1.4.1106 48 .
Short-timescale microfluidic experiments
Strain W303-1A was transformed with MIG1-GFP-KanMX and NRD1-mCherry hphNT1 using standard methods for yeast genetics and transformation 58. Cells were grown to mid-exponential phase in YNB supplied with 3% ethanol overnight. A glass-bottom petri dish (GWST-5030, WillCo Wells, UK) was treated with concanavalin A solution (1 mg/ml in 10 mM Tris-HCl buffer, 100 mM NaCl, adjusted to pH 8.0 using 5 M HCl) for 30 min at room temperature. The concanavalin A solution was removed and incubated for 5 min at 30°C after the cell suspension was added. Cells which did not adhere to the surface were removed by washing with YNB containing 3% ethanol. Exposure of cells to different conditions was performed using a BioPen system (Fluicell AB, Sweden) and an environmental chamber to hold the temperature at 30°C during exposure. Experiments were performed on an inverted microscope Olympus cellR widefield microscope system, based on an inverted IX81 motorized microscope with a Xe light source (MT20) and a Hamamatsu C8484 CCD camera. Images were acquired using a U PlanS Apo 40x NA 0.95l objective. The filter cubes, light intensities and exposure time and light intensities for all imaging channels used were as following for GFP: excitation 472/30 nm, emission 520/35 nm with an intensity of 20% for 350 ms. mCherry: excitation 560/40 nm, emission 630/75 nm with an intensity of 20% for 150 ms. The microscope and the microfluidic device were controlled using the Experiment Manager in the Xcellence software. Three images with an axial distance of 0.8 µm were acquired in transmission and fluorescent channels. The acquisition time for one set of images at each time point was ≈15 s. Images were acquired at changing imaging intervals to reduce phototoxicity and bleaching while keeping appropriate timing to monitor changes in Mig1 localization. Time-lapse imaging was performed three times every 30 s until the media shift, followed by 15 times every 20 s, followed by five times every 120 s, adding up to an overall experiment time of 16 min. Brightfield images acquired above the focal plane were divided by images acquired below the focal plane using custom Matlab Scripts. Division of images leads to the elimination of uneven illumination and enhances the diffraction pattern of cells. Segmentation was performed on the resulting images using CellX 59. The Mig1-localization index was calculated from the CellX output as follows:
Cells were tracked using custom MATLAB scripts according to previously described methods 60.
Western Blot analysis of Snf1 phosphorylation
Cell lysates were prepared as described in Caligaris et al. 61. After denaturation at 98°C for 5 min, samples subjected to SDS-PAGE and transferred onto nitrocellulose membranes. After 1 h blocking with blocking buffer (5% milk powder in tris-buffered saline), membranes were immunoblotted with anti-pT172-AMPK (Cell Signaling, 1:1000 dilution) or anti-Cdc34 (1:5000 dilution) primary antibodies 62. After three washes, the membranes were incubated with anti-rabbit secondary antibodies conjugated to horseradish peroxidase, washed again three times, and developed with ECL (GE Healthcare).
Bands were quantified using the Image lab software (Bio-Rad) and quantification results were plotted as phosphorylation ratio relative to the control condition containing ethanol, normalized to Cdc34.
RNA extraction and qPCR
Cells were collected by filtration and rapidly frozen at -80°C. RNA extraction and qPCR were performed as in Tripodi et al. 63. Briefly, cells were resuspended in LETS buffer (200 mM LiCl, 20 mM EDTA, 20 mM Tris-HCl, SDS 20%), phenol:chloroform:isoamyl alcohol (PCI) was added and cells were lysed by vortex-mixing with glass beads. A second step of PCI separation was performed. RNA was selectively precipitated with LiCl (0.5 M) at -80°C. 40 µg of RNA was treated with 6 units of DNase I (Jena Biosciences) for 1 h at 37°C, followed by PCI extraction and ethanol precipitation at -80°C. Reverse transcription of 0.5 µg mRNA was carried out with iScript cDNA Synthesis Kit (BIO-RAD). Quantitative Real-time PCR for SUC2 and HXK1 gene expression was performed by using ChamQ Universal SYBR pPCR Master Mix (Vazyme) on a CFX Connect Real-Time PCR System (BIO-RAD). The obtained data were normalized on CDC28 and CDC34 reference genes and the sample before the upshift was set to 1; data were analyzed with Maestro CFX software (BIO-RAD).
SUPPLEMENTAL INFORMATION
 Download Supplemental Information
ACKNOWLEDGMENTS
This work was supported by the Swedish Research Council (VR2016-03744, VR2017-05117 and VR2023-04319) and the Swedish Foundation for Strategic Research (FFL15- 0238) to MC and the grant 2023-ATE-0068 to F.T. (Fondo di Ateneo Quota Dipartimentale, FAQD, Università degli Studi di Milano-Bicocca). We acknowledge the Centre for Cellular Imaging at the University of Gothenburg and the National Microscopy Infrastructure, NMI (VR-RFI 2019-00217) for providing assistance in confocal microscopy and FRAP.
COPYRIGHT
© 2024

Exploring carbon source related localization and phosphorylation in the Snf1/Mig1 network using population and single cell-based approaches by Braam et al. is licensed under a Creative Commons Attribution 4.0 International License.