Research Reports:
Microbial Cell, Vol. 3, No. 2, pp. 79 - 88; doi: 10.15698/mic2016.02.478
The transcriptional repressor Sum1p counteracts Sir2p in regulation of the actin cytoskeleton, mitochondrial quality control and replicative lifespan in Saccharomyces cerevisiae
1 Department of Pathology and Cell Biology, Columbia University, New York, NY, USA.
2 Herbert Irving Comprehensive Cancer Center, Columbia University, New York, NY, USA.
3 Current address: Department of Neuroscience, University of Wisconsin, Madison, WI, USA.
4 Current address: Department of Genetics, Stanford University, Stanford, CA, USA.
5 Department of Biological Sciences, Hunter College and The Graduate Center Biochemistry, Biology and Biopsychology and Behavioral Neuroscience Programs, CUNY, New York, NY 10065, USA. Current address: Weill Institute for Cell and Molecular Biology, Cornell University, Ithaca, NY, USA.
Keywords: mitochondria, aging, actin cytoskeleton, sirtuin.
Abbreviations:
RACF - retrograde actin cable flow,
RLS - replicative lifespan.
Received originally: 09/10/2015 Received in revised form: 12/12/2015
Accepted: 15/12/2015
Published: 18/01/2016
Correspondence:
Liza A. Pon, Department of Pathology and Cell Biology, Columbia University, 630 W. 168th St. P&S 14-442; New York, NY 10032, USA lap5@columbia.edu
Conflict of interest statement: The authors declare that they have no conflict of interest.
Please cite this article as: Ryo Higuchi-Sanabria, Jason D. Vevea, Joseph K. Charalel, Maria L. Sapar, Liza A. Pon (2016). The transcriptional repressor Sum1p counteracts Sir2p in regulation of the actin cytoskeleton, mitochondrial quality control and replicative lifespan in Saccharomyces cerevisiae. Microbial Cell 3(2): 79-88.
Abstract
Increasing the stability or dynamics of the actin cytoskeleton can extend lifespan in C. elegans and S. cerevisiae. Actin cables of budding yeast, bundles of actin filaments that mediate cargo transport, affect lifespan control through effects on mitochondrial quality control. Sir2p, the founding member of the Sirtuin family of lifespan regulators, also affects actin cable dynamics, assembly, and function in mitochondrial quality control. Here, we obtained evidence for novel interactions between Sir2p and Sum1p, a transcriptional repressor that was originally identified through mutations that genetically suppress sir2∆ phenotypes unrelated to lifespan. We find that deletion of SUM1 in wild-type cells results in increased mitochondrial function and actin cable abundance. Furthermore, deletion of SUM1 suppresses defects in actin cables and mitochondria of sir2∆ yeast, and extends the replicative lifespan and cellular health span of sir2∆ cells. Thus, Sum1p suppresses Sir2p function in control of specific aging determinants and lifespan in budding yeast.
INTRODUCTION
Mitochondria have emerged as central regulators of cellular fitness and aging through their functions in central metabolism and reactive oxygen species formation [1][2][3][4][5][6][7]. Our previous studies revealed that mitochondria are asymmetrically inherited during yeast cell division, and that this process affects mother and daughter cell fitness and lifespan [8]. Asymmetric inheritance of mitochondria also occurs in mammalian cells, and affects cell fate. Specifically, young and old mitochondria are segregated during division in human mammary stem-like cells, and the cell that receives young, presumably fitter mitochondria retains stem cell features while the cell that receives older, presumably less fit mitochondria, differentiate [9]. Asymmetric cell division has also been identified in neuronal stem cells, where a diffusion barrier in the endoplasmic reticulum ensures that damaged, dysfunctional proteins characterized by higher ubiquitination profiles are sequestered in differentiating cells [10].
–
The mechanism underlying asymmetric inheritance of mitochondria in mammalian cells is not well understood. However, one mechanism for inheritance of fitter mitochondria by yeast daughter cells is dependent upon the actin cytoskeleton. Actin cables are bundles of F-actin that align along the mother-bud axis and are essential for trafficking of cargo including mitochondria during cell division. In contrast to many cytoskeleton tracks, which are not motile, actin cables move from buds towards mother cells [11][12]. As a result of this retrograde actin cable flow (RACF), mitochondria that use actin cables as tracks for movement from mother cells to buds are effectively “swimming upstream” against the force of RACF, and only fitter mitochondria, that are more motile, are more reduced, and contain less ROS, can move from mother cell to bud and be retained there [8].
–
There are other lines of evidence suggesting the importance of actin cytoskeletal dynamics in cellular health. For example, aged muscle cells have defects in actin organization in C. elegans [13]. Similarly, loss of actin regulation prevents activation of aged T cells [14]. Indeed, recent studies indicate that stabilization of the actin cytoskeleton in C. elegans extends lifespan [15]. Thus, actin function declines with age in model organisms and mammals, and promoting the function of the actin cytoskeleton can extend lifespan in yeast and C. elegans.
–
Here, we describe a novel interaction between Sir2p and Sum1p in regulation of the actin cytoskeleton, actin-mediated mitochondrial quality control, and lifespan regulation. Silent Information Regulator 2 (SIR2), originally described as a regulator of transcriptional silencing [16][17], was the first sirtuin to be described as a lifespan regulator [18]. While the link between sirtuins and lifespan regulation is still controversial [19][20][21][22], sirtuin activity has been shown by numerous groups to be involved in mitochondrial quality control in mammals [23][24][25]. Moreover, recent work in S. cerevisiae indicates that deletion of SIR2 results in loss of actin polarity, decreased actin cable abundance, decreased rates of RACF, and misfolding of actin protein [8][26][27]. This loss of cytoskeletal control results in decreased mitochondrial quality and cellular health span [8]. However, it is still unclear how sirtuins exert their role in mitochondrial quality control in mammals.
–
Sum1p is a promoter-specific repressor, which functions by recruitment of the histone deacetylase, Hst1p [28]. Sum1p was originally identified as a suppressor for Sir2p. Since SIR2 was known as MAR1 at the time, the gene was named Suppressor of MAR1. More specifically, a sum1-1 mutant was originally characterized as a recessive mutation that ameliorates the defects in gene silencing and mating found in sir2∆ cells [29]. Sum1p mediates transcriptional silencing of NAD+ biosynthesis genes [30], middle sporulation genes [31], and HM mating-type loci [32]. Here, we report that Sum1p and Sir2p inversely regulate actin and mitochondrial maintenance, as well as lifespan.
RESULTS
sum1∆ cells have increased transcriptional expression of widespread genes
To further characterize the role of Sum1p in transcriptional repression, we used next-generation RNA sequencing (RNAseq) to measure differences in gene expression in sum1∆ cells compared to wild-type cells. Predictably, given the role of Sum1p as a transcriptional repressor, we find that a majority of the genes with differential expression (using a P-value < 0.05 as a cutoff) are up-regulated in sum1∆ cells: 191 genes have significantly increased expression in sum1∆ cells compared to only 23 genes showing decreased expression (Table S1-S2). To identify potential mechanistic pathways that Sum1p may be involved in, we used the FunSpec algorithm [33] to group gene ontology (GO) terms related to the 191 up-regulated genes found in sum1∆ cells, and used the REVIGO algorithm to remove redundant GO terms and group related GO terms in semantic similarity-based scatterplots (Fig. S1) [34]. In accordance with previous reports, we detect up-regulation of genes involved in reproductive processes including spore formation in sum1∆ cells. In addition, the BNA family of genes (BNA1-6), previously identified in microarray studies, is up-regulated in sum1∆ cells. Since these genes are directly involved in de-novo NAD+ biosynthesis, it is possible that deletion of SUM1 results in increased total cellular NAD+ and positively influences Sir2p activity [30].
–
Deletion of SUM1 increases actin cable abundance in wild-type cells and rescues defects in actin cable abundance found in sir2∆ cells
Deletion of SIR2 results in depolarization of the actin cytoskeleton, a significant decrease in actin cable number and rate of RACF, and defects in actin protein folding [8][27]. We confirmed the decline in actin cable abundance in sir2∆ cells (Fig. 1A-B). Conversely, overexpression of SIR2 has the opposite effect (Fig. 2A-B). Furthermore, we find that deletion of SUM1 results in an increase in actin cable abundance to levels higher than those observed in wild-type cells (Fig. 1A-B) and an increase in the rate of RACF (Fig. S2).
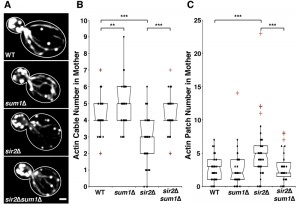 | FIGURE 1: Deletion of SUM1 suppresses defects in cytoskeletal integrity of sir2∆ cells. (A) Wild-type, sum1∆, sir2∆, and sir2∆ sum1∆ cells were stained with rhodamine-phalloidin as described in Materials and Methods. Scale bar represents 1 µm. Outlines were drawn from brightfield images. (B) Notched dot box plot of the number of polarized actin cables greater than half the length of the mother cell. The central band in the box represents the median, boxes indicate the middle quartiles, whiskers extend to the 5th and 95th percentiles, and red points indicate outliers (defined as quartile ± 1.5x the interquartile range). n = 45 - 62 cells per strain. Data is representative of 3 independent trials. ** = P < 0.01, *** = P < 0.001. P values were calculated using Kruskal-Wallis testing. (C) Notched dot box plot of the number of actin patches in the mother cell. Here, actin patches in the mother cell were quantified by visual inspection of cells bearing a small to medium bud (defined as cells with a ratio of bud:mother diameter of 0.2 to 0.6). During polarized growth, endocytosis and formation of actin patches occurs primarily in daughter cell. Therefore, mislocalization of patches into the mother cell early in the cell cycle is used as a marker for loss of polarity. n = 45 - 62 cells per strain. Data is representative of 3 independent trials. *** = P < 0.001. P values were calculated using Kruskal-Wallis testing. |
Since deletion of SUM1 results in an increase in NAD+ biosynthetic enzymes, which in turn may increase Sir2p activity, it is possible that Sum1p function in actin cytoskeletal integrity may be due to effects on Sir2p. Indeed, while overexpression of SIR2 results in an increase in actin cable abundance, deletion of SUM1 in SIR2-overexpressing cells does not have an additive effect on actin cable abundance (Fig. 2A-B). These findings indicate that Sum1p and Sir2p antagonistically regulate the actin cytoskeleton through similar mechanisms. On the other hand, we find that deletion of SUM1 ameliorates the defects in actin cable abundance found in sir2∆ cells (Fig. 1A-B). Thus, Sum1p has additional functions beyond direct regulation of Sir2p activity.
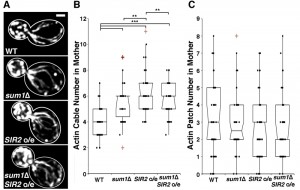 | FIGURE 2: Overexpression of SIR2 and deletion of SUM1 have complementary roles in regulation of actin cytoskeletal integrity. (A) Wild-type, sum1∆, SIR2 overexpressing (SIR2 o/e), and sum1∆ SIR2 o/e cells were stained with rhodamine-phalloidin as described in Materials and Methods. Scale bar represents 1 µm. Outlines were drawn from brightfield images. (B) Notched dot box plot of the number of actin cables in wild-type, sum1∆, SIR2 o/e, and sum1∆ SIR2 o/e cells. (C) Number of actin patches in the mother cell of wild-type, sum1∆, SIR2 o/e, and sum1∆ SIR2 o/e cells. n = 56 - 69 cells per strain. Data is representative of 2 independent trials. ** = P < 0.01, *** = P < 0.001. P values were calculated using Kruskal-Wallis testing. |
To investigate the role of Sum1p in the polarization of the actin cytoskeleton, we examined the distribution of actin patches, which are endocytic vesicles coated with F-actin that are primarily found in the bud during polarized yeast cell division. Localization of 4 or more actin patches in mother cells, using conventional fluorescence imaging, is indicative of loss of polarity in the actin cytoskeleton [35]. Deletion of SIR2 results in an elevated number of actin patches in the mother cell. This polarity defect in sir2∆ cells, like the defect in actin cable abundance, is ameliorated by the deletion of SUM1 (Fig. 1C). We find no major differences in actin patch localization in wild-type or sum1∆ cells overexpressing SIR2 (Fig. 2C).
–
Deletion of SUM1 promotes mitochondrial quality in wild-type cells and rescues mitochondrial function in sir2∆ cells
Recent work from our laboratory identified a novel role for Sir2p in regulation of RACF [8] and in regulating mitochondrial quality control, in part, through its effects on RACF. Since deletion of SUM1 also results in an increase in RACF (Fig. S2), we studied the effect of deletion of SUM1 on mitochondrial function by analysis of two parameters: 1) mitochondrial redox state and 2) mitochondrial motility. Mitochondrial redox state was measured using mitochondria-targeted redox-sensing GFP1 (mito-roGFP1), which contains two surface-exposed cysteines. Oxidation or reduction of the cysteines occurs in response to the redox state of the environment and alters the excitation spectrum of roGFP1 [36]. When roGFP1 is targeted to yeast mitochondria, its fluorescence ratio serves as an effective biosensor for mitochondrial redox state [37].
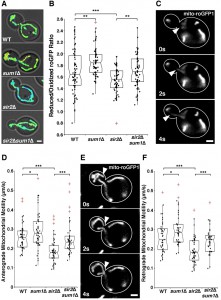 | FIGURE 3: Deletion of SUM1 ameliorates defects in mitochondrial function in sir2∆ cells. (A) mito-roGFP1 was used to visualize redox state of mitochondria in wild-type, sum1∆, sir2∆, and sir2∆ sum1∆ cells. Images are reduced:oxidized mito-roGFP1 ratios overlaid on phase images. Higher numbers and warmer colors indicate more reducing mitochondria. Scale bar, 1 µm. (B) Notched dot box plot of the average reduced:oxidized mito-roGFP1 ratio in wild-type, sum1∆, sir2∆, and sir2∆ sum1∆ cells. n = 53 - 77 cells per strain. Data is representative of 3 independent trials. (C) Time-lapse frames showing the tip of a Cit1p-GFP-labelled mitochondrial tubule undergoing anterograde movement. (D) Notched dot box plot of anterograde mitochondrial velocity in wild-type, sum1∆, sir2∆, and sir2∆ sum1∆ cells. n = 48 - 54 cells per strain. Data is pooled from 3 independent trials. (E) Time-lapse frames showing the tip of a mito-roGFP1-labelled mitochondrial tubule undergoing retrograde movement. (F) Notched dot box plot of retrograde mitochondrial movement in wild-type, sum1∆, sir2∆, and sir2∆ sum1∆ cells. n = 48 - 54 cells per strain. Data is pooled from 3 independent trials. * = P < 0.05, ** = P < 0.01, *** = P < 0.001. P values were calculated using Kruskal-Wallis testing. Bars: 1μm. Cell outlines are shown in white. |
Consistent with previous findings, sir2∆ cells have a significant decline in mitochondrial function as measured by more oxidizing environments (Fig. 3A-B) and decreased anterograde (Fig. 3C-D) and retrograde mitochondrial velocities (Fig. 3E-F). Overexpression of SIR2 has the opposite effect (Fig. 4). More importantly, we find that deletion of SUM1 in wild-type cells results in a modest, but significant improvement in mitochondrial redox state and motility. Additionally, we find that deletion of SUM1 in sir2∆ cells results in complete rescue of mitochondrial redox state and mitochondrial motility to wild-type levels. These data provide further evidence of a link between cytoskeletal integrity and mitochondrial function and that SUM1 and SIR2 act antagonistically in these processes.
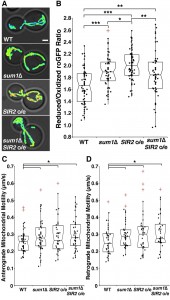 | FIGURE 4: Overexpression of SIR2 and deletion of SUM1 have complementary roles in regulation of mitochondrial quality and function. (A) Reduced:oxidized mito-roGFP1 ratios overlaid on brightfield images for wild-type, sum1∆, SIR2 o/e, and sum1∆ SIR2 o/e cells. Higher numbers and warmer colors indicate more reducing mitochondria. Scale bar, 1 µm. (B) Notched dot box plot of the average reduced:oxidized mito-roGFP1 ratio in wild-type, sum1∆, SIR2 o/e, and sum1∆ SIR2 o/e cells. n = 53 - 66 cells per strain. Data is representative of 3 independent trials. (C-D) Notched dot box plot of anterograde and retrograde mitochondrial movements for wild-type, sum1∆, SIR2 o/e, and sum1∆ SIR2 o/e cells. n = 43 - 54 cells per strain. Data is pooled form 3 independent trials. * = P < 0.05, ** = P < 0.01, *** = P < 0.001. P values were calculated using Kruskal-Wallis testing. Bars: 1μm. Cell outlines are shown in white. |
Consistent with our findings on the actin cytoskeleton, we find that deletion of SUM1 does not further enhance mitochondrial quality in cells overexpressing SIR2 (Fig. 4A-B). The lack of an additive effect on mitochondrial fitness provides further evidence that Sir2p and Sum1p function in similar mechanistic pathways to control the actin cytoskeleton and mitochondria.
–
Deletion of SUM1 promotes lifespan in sir2∆ cells
We next investigated whether the Sum1p-mediated increase in mitochondrial quality is physiologically relevant to cellular health and lifespan. Two distinct forms of cellular aging are studied in yeast. Chronological lifespan, the survival time of non-dividing yeast in a saturated culture, is a model for stress resistance in post-mitotic cells. Replicative lifespan (RLS) is a model for aging of division-competent cells and is measured as the number of times a cell can divide prior to senescence. We find that the mean RLS of wild-type, sir2∆, sum1∆, and sir2∆ sum1∆ are 21.4 ± 2.7, 13.7 ± 0.95, 19.0 ± 0.90 and 19.3 ± 0.70 generations, respectively. Thus, we find that deletion of SUM1 does not have a significant effect on RLS. More importantly, we find that the decrease in RLS produced by deletion of SIR2 is suppressed by deletion of SUM1 (Fig. 5A).
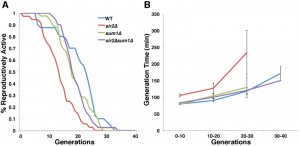 | FIGURE 5: Deletion of SUM1 rescues defects in RLS and cellular health span of sir2∆ cells. (A) RLSs of wild-type, sir2∆, sum1∆, and sir2∆sum1∆ cells were determined as described in Materials and Methods. (B) Mean generation time was determined during the RLS assay as described in Materials and Methods. Error bars represent SEM. n = 40 cells per strain. Data is representative of 2 independent trials. |
Cellular health in yeast is measured by mean generation time, which increases as the cell ages [38]. Deletion of SUM1 does not affect health span: the mean generation time of sum1∆ cells is indistinguishable from that observed in wild-type cells. We confirmed that deletion of SIR2 results in a significant increase in generation time, even at a young age (Fig. 5B). Moreover, we find that the decreased health span produced by deletion of SIR2 is ameliorated by deletion of SUM1. Thus, deletion of SUM1 restores lifespan and health span in sir2∆ cells.
DISCUSSION
Previous studies revealed that deletion of SIR2 results in defects in folding of the actin protein, as well as a decrease in actin cable abundance and dynamics [8][27], which in turn results in inheritance of less fit mitochondria by yeast daughter cells and reduced cellular health span [8]. Other studies showed that the sum1-1 mutation, which affects transcriptional regulation by Sum1p, rescues mating defects in sir2∆ cells [28][29][32]. Here, we show that SUM1 acts to antagonize multiple SIR2 functions. In particular, deletion of SUM1 ameliorates defects in actin cytoskeletal integrity, mitochondrial quality, and lifespan characteristic of sir2∆ cells.
–
We find that deletion of SUM1 alone results in an increase in actin cable abundance and RACF velocity and in improved mitochondrial function. Furthermore, deletion of SUM1 in sir2∆ cells completely rescues defects in the actin cytoskeleton and mitochondria that occur in sir2∆ cells. To determine the relationship between the Sum1p and Sir2p pathways, we deleted SUM1 in SIR2-overexpressing cells, which display an increase in actin cable abundance and mitochondrial function [8] similar to that found in sum1∆ cells. We find that overexpression of SIR2 and deletion of SUM1 do not have an additive effect on actin cable abundance or mitochondrial function. This is not due to an independent cellular limit on cable abundance or mitochondrial function. Overexpression of Tpm1p, a tropomyosin isoform that stabilizes actin cables, results in a higher number of actin cables compared to that observed in sum1∆, SIR2-overexpressing yeast. Similarly, mitochondria are more reduced in yeast undergoing respiration-driven growth than in sum1∆, SIR2-overexpressing yeast (data not shown). Thus, our findings indicate that Sum1p and Sir2p affect the actin cytoskeleton and mitochondrial function through the same pathway.
–
Consistent with this, we find that deletion of SUM1 rescues defects in RLS and cellular health span seen in sir2∆ cells. That is, the RLS of sir2∆ sum1∆ yeast is equal to that of sum1∆ cells. Interestingly, sum1∆ cells do not have increased RLS compared to wild-type cells, despite having increased actin cable count and higher mitochondrial quality. This may be due to the pleiotropic effects of SUM1 deletion. Indeed, previous studies have reported a role for Sum1p in regulation of the microtubule cytoskeleton [39][40]. It is possible that loss of microtubule maintenance or some other unidentified function of Sum1p – independent of Sir2p activity – contributes to lifespan defects, which mask the positive effects of actin and mitochondrial quality.
–
Overall, we obtained evidence for a novel role for Sum1p, a suppressor of Sir2p, in regulation of actin cytoskeleton and mitochondrial control. We also identified a novel role for Sum1p in lifespan control and cellular health span. Finally, we obtained evidence that SUM1 and SIR2 affect actin, mitochondria, and lifespan through effects on the same pathway.
–
Previous reports indicate that Sir2p can also affect RLS through effects on generation of extrachromosomal rDNA circles, which are selectively retained in mother cells [18]; activation of catalase in daughter cells after cytokinesis [27]; and asymmetric inheritance of protein aggregates [41]. The actin cytoskeleton, which is required for asymmetric inheritance of mitochondria, catalase activity and protein aggregates, is also affected by both Sum1p and Sir2p. Thus, while it’s clear that increasing RACF results in lifespan extension through effects on inheritance of fitter mitochondria by yeast daughter cells, it is possible that other actin-dependent or actin-independent asymmetric inheritance events contribute to the extended lifespan observed in sum1∆ or SIR2-overexpressing cells.
–
Finally, sum1-1, the allele that suppresses Sir2p, affects the transcriptional activity of Sum1p [42]. Therefore, we favor the notion that SUM1 controls lifespan through its function as a transcriptional regulator. Our transcriptome analysis confirmed a significant increase in NAD+ biosynthetic enzymes (BNA1-6) [30]. It is possible that the increased expression of the BNA family genes results in an increased available pool of NAD+, which increases Sir2p activity. Since deletion of SUM1 can also extend lifespan in sir2∆ cells, it is possible that elevated NAD+ levels in sum1∆ cells extend lifespan through effects on other NAD+-dependent protein deacetylases, such as Hst1 and Hst2. Alternatively, there may be other pathways activated in sum1∆ cells that promote longer lifespan. Indeed, we find that sum1∆ cells show greater than 1000-fold overexpression of several previously uncharacterized open reading frames, such as YGl138c, YLR308W, and YNL318c. It is possible that these genes contribute to Sir2p-dependent and/or Sir2p-independent control of lifespan.
MATERIALS AND METHODS
Yeast Growth Conditions
Yeast cells were cultivated and manipulated as previously described [43] and are derivatives of the BY4741 strain (MATa his3∆1 leu2∆0 met15∆0 ura3∆0) from Open Biosystems (Huntsville, AL). All experiments were carried out with cultures grown to mid-log phase (OD600 0.1-0.3) unless otherwise noted. For all imaging studies, synthetic complete (SC) media was used with dropouts where needed. For all non-imaging studies, rich, glucose-based medium (yeast-peptone-dextrose, YPD) was used for strains not requiring selection and SC with corresponding dropouts was used for strains requiring selection.
–
Yeast strain construction
Knockout strains (Table S4) were created by replacing the gene of interest with LEU2 or KanMX6 cassettes using primers listed in Supplemental Table 5. BY4741 strains were transformed using the lithium acetate method with a PCR product containing the coding regions of the selection marker and sequences directly upstream of the start codon and downstream of the stop codon of the gene being knocked out. The LEU2 auxotrophic selection marker was removed from strain RHY117 (MATa his3∆1 leu2∆0 met15∆0 ura3∆0 SIR2-3HA-kanMX6 sum1∆::0 sir2∆::KanMX6) using a galactose-inducible Cre recombinase on plasmid pSH62 (Euroscarf, University of Frankfurt) [44] induced for 4 hrs at 30°C in media containing galactose. Excision of LEU2 was confirmed by failure to grow on SC-Leu media.
–
Visualization of the actin cytoskeleton with rhodamine-phalloidin
Cells were grown to mid-log phase in SC with dropouts where needed and fixed by incubation in 3.7% paraformaldehyde added directly to the growth medium at 30°C with shaking for 50 min. Fixed cells were washed with wash solution (0.025 M KPi pH 7.5, 0.8 M KCl) three times and with PBT (PBS containing 1% w/v BSA, 0.1% v/v Triton X-100, 0.1% w/v sodium azide) once. Actin was stained with 1.65 µM rhodamine-phalloidin in PBT (Molecular Probes, Eugene, OR) for 35 min at RT in the dark. Cells were then washed three times with PBS, resuspended in mounting solution (0.1% w/v p-phenylenediamine and 90% v/v glycerol in PBS) and mounted on microscope slides for visualization.
–
Fluorescence microscopy was performed on a Zeiss AxioObserver.Z1 microscope (Carl Zeiss Inc., Thornwood, NY) equipped with a metal halide lamp, standard rhodamine filter (Zeiss filter set 43 HE; excitation 550/25, dichroic FT 570, emission 605/70) and an Orca ER cooled CCD camera (Hamamatsu Photonics, Bridgewater, NJ) and driven by Axiovision software (Carl Zeiss Inc., Thornwood, NY). Using a 100x/1.3 NA EC-PlanNeoFluar objective lens, z-series were collected through the entire cell at 0.3 µm intervals using 1×1 binning, 50 ms exposure, and analog gain at 216. Images were deconvolved using a constrained iterative restoration algorithm (Volocity, Perkin-Elmer, Waltham, MA) with the following parameters: 620 nm emission wavelength, 60 iterations, and 100% confidence interval. Cells with small and medium-sized buds (0.20 to 0.60 bud-to-mother diameter ratio) were selected for quantification of actin cables and patches in the mother cell. Actin cable abundance was scored as number of actin cables parallel to the mother-bud axis spanning minimally half of the mother cell diameter.
–
Measurement of redox state using mito-roGFP1
mito-roGFP1 was expressed from a centromeric plasmid containing the mitochondrial targeting sequence of ATP9 fused to roGFP1 [45]. Strains expressing mito-roGFP1 were grown to mid-log phase and 1.5 µL of cell suspension was applied to a microscope slide, covered with a cover slip, and imaged immediately for a maximum of 15 min. mito-roGFP1 was imaged on the Zeiss AxioObserver.Z1 microscope described above using a modified GFP filter (Zeiss filter set 46 HE with excitation filter removed, dichroic FT 515, emission 635/30). Using a 100x/1.3 NA EC-PlanNeoFluar objective lens, z-series were collected through the entire cell at 0.3 µm intervals using 1×1 binning, 365 nm LED at 25% power with 100 ms exposure time for oxidized form and 470 nm LED at 100% power with 100 ms exposure time for reduced form, with analog gain at 216. Images were deconvolved using a constrained iterative restoration algorithm with the following parameters: 507 nm emission wavelength, 60 iterations over 100% confidence interval. For quantification of redox state, Volocity was used to calculate the ratio with background selection and thresholding steps.
–
Analysis of velocity of mitochondrial movement
For time-lapse imaging of mitochondria, mito-roGFP1 was excited only at 470 nm in a single plane at the center of the mother cell at 1-sec intervals for a total of 30 sec using 1×1 binning, 75 ms exposure, and analog gain of 216. The change in position of the tip of a mitochondrial tubule was recorded as a function of time. Mitochondrial movement was scored if the tubule tip underwent three or more consecutive movements in the same direction. Image enhancement and analysis were performed using Volocity software.
–
Determination of RLS and generation time
RLS measurements were performed on YPD plates at 30°C. Single colonies of each yeast strain were suspended in liquid YPD and grown at 30°C with shaking to mid-log phase. A 2-µL aliquot of cell suspension was applied to a YPD plate. Small-budded cells were isolated and arranged in a matrix using a micromanipulator mounted on a dissecting microscope (Carl Zeiss, Thornwood, NY). After the initial cell division, mother cells were removed and discarded. The remaining daughter cells were named virgin mother cells, and after each successive replication, daughter cells were removed and counted until the virgin mother cell reached senescence. Mean generation time was recorded as the time between successive replications. RLS measurements were done without pause and plates were never moved to 4°C for storage due to a potential cold-sensitive nature of the sum1∆ cells [40].
–
Analysis of retrograde actin cable flow
Cells expressing Abp140-GFP were grown to mid-log phase in SCRaff media. 1.5 µL of cell suspension was spread over the surface of a glass slide and covered with a cover slip. Slides were imaged within 2 minutes after slide preparation. Abp140-GFP was imaged using a Zeiss 100x/1.4 Plan-Apochromat objective lens, a 470 nm LED at 80% power for excitation, and a standard GFP filter (Zeiss filter set 46 HE; dichroic FT 515, emission 535/30). Images were collected at a focal plane 0.5 – 1 µm above the center of the mother cell, at 0.9-sec intervals for a total of 15 sec using 1×1 binning, 200 ms exposure, and analog gain of 255. Velocity was measured by measuring the change in position of the tip of moving or elongating cables, or the movement of fiduciary marks along actin cables, as a function of time, as previously described [12].
–
Other methods
All non-parametric statistical testing and production of box plots were performed using the Analyze-it add-on for Microsoft Excel.
–
RNA isolation was performed as per manufacturer’s guide using a Qiagen RNeasy Mini Kit (#74104, Qiagen, Germantown, MD). RNA quality was assessed and RNA Integrity Number (RIN) scores were all above 10 using a Plant RNA Nano chip. RNA-seq was performed on an Illumina HiSeq2000 generating 200m 100 bp single end reads per lane, and differential gene expression analysis of wild-type and sum1∆ cells was performed by the Columbia Genome Center. Data was organized into gene ontology (GO) terms using the Saccharomyces Genome Database’s GO Annotation algorithm. REVIGO was used to remove redundant GO terms and group-related GO terms in semantic similarity-based scatterplots [34].
References
- H. Aguilaniu, L. Gustafsson, M. Rigoulet, and T. Nyström, "Asymmetric Inheritance of Oxidatively Damaged Proteins During Cytokinesis", Science, vol. 299, pp. 1751-1753, 2003. http://dx.doi.org/10.1126/science.1080418
- A.L. Hughes, and D.E. Gottschling, "An early age increase in vacuolar pH limits mitochondrial function and lifespan in yeast", Nature, vol. 492, pp. 261-265, 2012. http://dx.doi.org/10.1038/nature11654
- C. López-Otín, M.A. Blasco, L. Partridge, M. Serrano, and G. Kroemer, "The Hallmarks of Aging", Cell, vol. 153, pp. 1194-1217, 2013. http://dx.doi.org/10.1016/j.cell.2013.05.039
- C.B. Park, and N. Larsson, "Mitochondrial DNA mutations in disease and aging", Journal of Cell Biology, vol. 193, pp. 809-818, 2011. http://dx.doi.org/10.1083/jcb.201010024
- R. Ramadasan-Nair, N. Gayathri, S. Mishra, B. Sunitha, R.B. Mythri, A. Nalini, Y. Subbannayya, H.C. Harsha, U. Kolthur-Seetharam, and M.M.S. Bharath, "Mitochondrial Alterations and Oxidative Stress in an Acute Transient Mouse Model of Muscle Degeneration", Journal of Biological Chemistry, vol. 289, pp. 485-509, 2014. http://dx.doi.org/10.1074/jbc.M113.493270
- K.L. Stauch, P.R. Purnell, and H.S. Fox, "Aging synaptic mitochondria exhibit dynamic proteomic changes while maintaining bioenergetic function.", Aging, 2014. http://www.ncbi.nlm.nih.gov/pubmed/24827396
- R. Higuchi-Sanabria, W.M. Pernice, J.D. Vevea, D.M. Alessi Wolken, I.R. Boldogh, and L.A. Pon, "Role of asymmetric cell division in lifespan control inSaccharomyces cerevisiae", FEMS Yeast Research, vol. 14, pp. 1133-1146, 2014. http://dx.doi.org/10.1111/1567-1364.12216
- R. Higuchi, J. Vevea, T. Swayne, R. Chojnowski, V. Hill, I. Boldogh, and L. Pon, "Actin Dynamics Affect Mitochondrial Quality Control and Aging in Budding Yeast", Current Biology, vol. 23, pp. 2417-2422, 2013. http://dx.doi.org/10.1016/j.cub.2013.10.022
- P. Katajisto, J. Döhla, C.L. Chaffer, N. Pentinmikko, N. Marjanovic, S. Iqbal, R. Zoncu, W. Chen, R.A. Weinberg, and D.M. Sabatini, "Asymmetric apportioning of aged mitochondria between daughter cells is required for stemness", Science, vol. 348, pp. 340-343, 2015. http://dx.doi.org/10.1126/science.1260384
- D.L. Moore, G.A. Pilz, M.J. Araúzo-Bravo, Y. Barral, and S. Jessberger, "A mechanism for the segregation of age in mammalian neural stem cells", Science, vol. 349, pp. 1334-1338, 2015. http://dx.doi.org/10.1126/science.aac9868
- T.M. Huckaba, T. Lipkin, and L.A. Pon, "Roles of type II myosin and a tropomyosin isoform in retrograde actin flow in budding yeast", The Journal of Cell Biology, vol. 175, pp. 957-969, 2006. http://dx.doi.org/10.1083/jcb.200609155
- H. Yang, and L.A. Pon, "Actin cable dynamics in budding yeast", Proceedings of the National Academy of Sciences, vol. 99, pp. 751-756, 2002. http://dx.doi.org/10.1073/pnas.022462899
- L.A. Herndon, P.J. Schmeissner, J.M. Dudaronek, P.A. Brown, K.M. Listner, Y. Sakano, M.C. Paupard, D.H. Hall, and M. Driscoll, "Stochastic and genetic factors influence tissue-specific decline in ageing C. elegans", Nature, vol. 419, pp. 808-814, 2002. http://dx.doi.org/10.1038/nature01135
- G. Garcia, A. Bertin, Z. Li, Y. Song, M.A. McMurray, J. Thorner, and E. Nogales, "Subunit-dependent modulation of septin assembly: Budding yeast septin Shs1 promotes ring and gauze formation", Journal of Cell Biology, vol. 195, pp. 993-1004, 2011. http://dx.doi.org/10.1083/jcb.201107123
- N.A. Baird, P.M. Douglas, M.S. Simic, A.R. Grant, J.J. Moresco, S.C. Wolff, J.R. Yates, G. Manning, and A. Dillin, "HSF-1–mediated cytoskeletal integrity determines thermotolerance and life span", Science, vol. 346, pp. 360-363, 2014. http://dx.doi.org/10.1126/science.1253168
- J.M. Ivy, A.J. Klar, and J.B. Hicks, "Cloning and characterization of four SIR genes of Saccharomyces cerevisiae.", Molecular and cellular biology, 1986. http://www.ncbi.nlm.nih.gov/pubmed/3023863
- J. Rine, and I. Herskowitz, "Four genes responsible for a position effect on expression from HML and HMR in Saccharomyces cerevisiae.", Genetics, 1987. http://www.ncbi.nlm.nih.gov/pubmed/3297920
- M. Kaeberlein, M. McVey, and L. Guarente, "The SIR2/3/4 complex and SIR2 alone promote longevity in Saccharomyces cerevisiae by two different mechanisms.", Genes & development, 1999. http://www.ncbi.nlm.nih.gov/pubmed/10521401
- J.H. Bauer, S.N.S. Morris, C. Chang, T. Flatt, J.G. Wood, and S.L. Helfand, "dSir2 and Dmp53 interact to mediate aspects of CR-dependent lifespan extension in D. melanogaster.", Aging, 2009. http://www.ncbi.nlm.nih.gov/pubmed/19851477
- C. Burnett, S. Valentini, F. Cabreiro, M. Goss, M. Somogyvári, M.D. Piper, M. Hoddinott, G.L. Sutphin, V. Leko, J.J. McElwee, R.P. Vazquez-Manrique, A. Orfila, D. Ackerman, C. Au, G. Vinti, M. Riesen, K. Howard, C. Neri, A. Bedalov, M. Kaeberlein, C. Sőti, L. Partridge, and D. Gems, "Absence of effects of Sir2 overexpression on lifespan in C. elegans and Drosophila", Nature, vol. 477, pp. 482-485, 2011. http://dx.doi.org/10.1038/nature10296
- C. Liao, and B.K. Kennedy, "Will the real aging Sirtuin please stand up?", Cell Research, vol. 22, pp. 1215-1217, 2012. http://dx.doi.org/10.1038/cr.2012.62
- H.A. Tissenbaum, and L. Guarente, "Increased dosage of a sir-2 gene extends lifespan in Caenorhabditis elegans", Nature, vol. 410, pp. 227-230, 2001. http://dx.doi.org/10.1038/35065638
- C. Koentges, K. Pfeil, T. Schnick, S. Wiese, R. Dahlbock, M.C. Cimolai, M. Meyer-Steenbuck, K. Cenkerova, M.M. Hoffmann, C. Jaeger, K.E. Odening, B. Kammerer, L. Hein, C. Bode, and H. Bugger, "SIRT3 deficiency impairs mitochondrial and contractile function in the heart", Basic Research in Cardiology, vol. 110, 2015. http://dx.doi.org/10.1007/s00395-015-0493-6
- J.T. Rodgers, C. Lerin, W. Haas, S.P. Gygi, B.M. Spiegelman, and P. Puigserver, "Nutrient control of glucose homeostasis through a complex of PGC-1α and SIRT1", Nature, vol. 434, pp. 113-118, 2005. http://dx.doi.org/10.1038/nature03354
-
Y. Yang, S. Jiang, Y. Dong, C. Fan, L. Zhao, X. Yang, J. Li, S. Di, L. Yue, G. Liang, R.J. Reiter, and Y. Qu, "Melatonin prevents cell death and mitochondrial dysfunction via a
SIRT 1‐dependent mechanism during ischemic‐stroke in mice", Journal of Pineal Research, vol. 58, pp. 61-70, 2014. http://dx.doi.org/10.1111/jpi.12193 - N. Erjavec, L. Larsson, J. Grantham, and T. Nyström, "Accelerated aging and failure to segregate damaged proteins in Sir2 mutants can be suppressed by overproducing the protein aggregation-remodeling factor Hsp104p", Genes & Development, vol. 21, pp. 2410-2421, 2007. http://dx.doi.org/10.1101/gad.439307
- N. Erjavec, and T. Nyström, "Sir2p-dependent protein segregation gives rise to a superior reactive oxygen species management in the progeny of Saccharomyces cerevisiae", Proceedings of the National Academy of Sciences, vol. 104, pp. 10877-10881, 2007. http://dx.doi.org/10.1073/pnas.0701634104
- P.J. Lynch, H.B. Fraser, E. Sevastopoulos, J. Rine, and L.N. Rusche, "Sum1p, the Origin Recognition Complex, and the Spreading of a Promoter-Specific Repressor in Saccharomyces cerevisiae", Molecular and Cellular Biology, vol. 25, pp. 5920-5932, 2005. http://dx.doi.org/10.1128/MCB.25.14.5920-5932.2005
- P. Laurenson, and J. Rine, "SUM1-1: a suppressor of silencing defects in Saccharomyces cerevisiae.", Genetics, 1991. http://www.ncbi.nlm.nih.gov/pubmed/1752414
- A. Bedalov, M. Hirao, J. Posakony, M. Nelson, and J.A. Simon, "NAD+-dependent deacetylase Hst1p controls biosynthesis and cellular NAD+ levels in Saccharomyces cerevisiae.", Molecular and cellular biology, 2003. http://www.ncbi.nlm.nih.gov/pubmed/12972620
- J. Xie, M. Pierce, V. Gailus-Durner, M. Wagner, E. Winter, and A.K. Vershon, "Sum1 and Hst1 repress middle sporulation-specific gene expression during mitosis in Saccharomyces cerevisiae", The EMBO Journal, vol. 18, pp. 6448-6454, 1999. http://dx.doi.org/10.1093/emboj/18.22.6448
- M.H. Chi, and D. Shore, "SUM1-1, a dominant suppressor of SIR mutations in Saccharomyces cerevisiae, increases transcriptional silencing at telomeres and HM mating-type loci and decreases chromosome stability.", Molecular and cellular biology, 1996. http://www.ncbi.nlm.nih.gov/pubmed/8754829
- M.D. Robinson, J. Grigull, N. Mohammad, and T.R. Hughes, "FunSpec: a web-based cluster interpreter for yeast.", BMC bioinformatics, 2002. http://www.ncbi.nlm.nih.gov/pubmed/12431279
- F. Supek, M. Bošnjak, N. Škunca, and T. Šmuc, "REVIGO Summarizes and Visualizes Long Lists of Gene Ontology Terms", PLoS ONE, vol. 6, pp. e21800, 2011. http://dx.doi.org/10.1371/journal.pone.0021800
- A.E. Adams, and J.R. Pringle, "Relationship of actin and tubulin distribution to bud growth in wild-type and morphogenetic-mutant Saccharomyces cerevisiae.", The Journal of cell biology, 1984. http://www.ncbi.nlm.nih.gov/pubmed/6365931
- G.T. Hanson, R. Aggeler, D. Oglesbee, M. Cannon, R.A. Capaldi, R.Y. Tsien, and S.J. Remington, "Investigating Mitochondrial Redox Potential with Redox-sensitive Green Fluorescent Protein Indicators", Journal of Biological Chemistry, vol. 279, pp. 13044-13053, 2004. http://dx.doi.org/10.1074/jbc.M312846200
- J.D. Vevea, T.C. Swayne, I.R. Boldogh, and L.A. Pon, "Inheritance of the fittest mitochondria in yeast", Trends in Cell Biology, vol. 24, pp. 53-60, 2014. http://dx.doi.org/10.1016/j.tcb.2013.07.003
- R.K. MORTIMER, and J.R. JOHNSTON, "Life span of individual yeast cells.", Nature, 1959. http://www.ncbi.nlm.nih.gov/pubmed/13666896
- S. Haldar, S. Sarkar, V. Singh, and P. Sinha, "High copies of SUM1 enhance the stability of wild-type microtubules against adverse conditions in Saccharomyces cerevisiae", Biochemical and Biophysical Research Communications, vol. 418, pp. 525-530, 2012. http://dx.doi.org/10.1016/j.bbrc.2012.01.059
- S. Sarkar, S. Haldar, S. Hajra, and P. Sinha, "The budding yeast protein Sum1 functions independently of its binding partners Hst1 and Sir2 histone deacetylases to regulate microtubule assembly", FEMS Yeast Research, vol. 10, pp. 660-673, 2010. http://dx.doi.org/10.1111/j.1567-1364.2010.00655.x
- J. Song, Q. Yang, J. Yang, L. Larsson, X. Hao, X. Zhu, S. Malmgren-Hill, M. Cvijovic, J. Fernandez-Rodriguez, J. Grantham, C.M. Gustafsson, B. Liu, and T. Nyström, "Essential Genetic Interactors of SIR2 Required for Spatial Sequestration and Asymmetrical Inheritance of Protein Aggregates", PLoS Genetics, vol. 10, pp. e1004539, 2014. http://dx.doi.org/10.1371/journal.pgen.1004539
- A. Sutton, R.C. Heller, J. Landry, J.S. Choy, A. Sirko, and R. Sternglanz, "A Novel Form of Transcriptional Silencing by Sum1-1 Requires Hst1 and the Origin Recognition Complex", Molecular and Cellular Biology, vol. 21, pp. 3514-3522, 2001. http://dx.doi.org/10.1128/MCB.21.10.3514-3522.2001
- F. Sherman, "Getting started with yeast.", Methods in enzymology, 2002. http://www.ncbi.nlm.nih.gov/pubmed/12073320
- U. Gueldener, J. Heinisch, G.J. Koehler, D. Voss, and J.H. Hegemann, "A second set of loxP marker cassettes for Cre-mediated multiple gene knockouts in budding yeast.", Nucleic acids research, 2002. http://www.ncbi.nlm.nih.gov/pubmed/11884642
- J.R. McFaline‐Figueroa, J. Vevea, T.C. Swayne, C. Zhou, C. Liu, G. Leung, I.R. Boldogh, and L.A. Pon, "Mitochondrial quality control during inheritance is associated with lifespan and mother–daughter age asymmetry in budding yeast", Aging Cell, vol. 10, pp. 885-895, 2011. http://dx.doi.org/10.1111/j.1474-9726.2011.00731.x
SUPPLEMENTAL INFORMATION
 Download Supplemental Information
ACKNOWLEDGMENTS
We thank the members of the Pon laboratory for technical assistance and valuable discussion. This work was supported by grants from the National Institutes of Health (NIH) (GM45735 and GM096445) and the Ellison Medical Foundation (AG-SS-2465-10) to LP, and support from the National Institutes of Health (NIH) (5 T32 DK7647) to RHS. The microscopes used for these studies are supported in part through a NIH/NCI grant (5 P30 CA13696).
COPYRIGHT
© 2016

The transcriptional repressor Sum1p counteracts Sir2p in regulation of the actin cytoskeleton, mitochondrial quality control and replicative lifespan in Saccharomyces cerevisiae by Ryo Higuchi-Sanabria et al. is licensed under a Creative Commons Attribution 4.0 International License.